Layers
Layers allow you to display a contour for a specified element layer when a layer definition is available for an element.
- Max
- Displays the maximum value among the layers for each entity.
- Min
- Displays the minimum value among the layers for each entity
- Extreme
- Displays the maximum absolute values among the layers for each entity.
- Sum
- Displays the (scalar) sum of all values among the layers for each entity.
- Average
-
Displays the (scalar) average value among the layers which contain data for each entity.
Layers that do not have values (N/A result) will not contribute to the averages (see the example below):
Layer 1 - 10.0
Layer 2 - 26.0
Layer 3 - 30.0
Average is (10+26+30)/3 = 66/3 = 22.0
However if:
Layer 1 - 10.0
Layer 2 - 26.0
Layer 3 - N/A
Average is (10+26)/2 = 36/2 = 18.0
- Range
- Displays the difference between the maximum and minimum values among the layers for
each entity.
The range is shown as zero if there is only one value (for example, for solid elements that do not have any layers or section points reported).
- Count
- Displays a count of the layers for the given data type. By default, the total number of layers/plies are given for each node/element. When used with a Layer Filter or Value Filter, the Count aggregation mode will have slightly different behavior (based on the filter criteria).
- MaxLayer
- Identifies and plots the layer by name that contributes to the maximum value for each entity.
- MinLayer
- Identifies and plots the layer by name that contributes to the minimum value for each entity.
- ExtremeLayer
- Identifies and plots the layer by name that contributes to the extreme (absolute maximum) value for each entity.
- Top/Bottom
- Displays the contour of top and bottom layers in the same plot. You can use this
option to specify which layer should be on the top or bottom.
Click the Top/Bottom layer setting icon
 to display the Top/Bottom Layer
dialog:Use the drop-down menu to specify a location (Lower, Mid, or Upper) for the Top layer and Bottom layer.
to display the Top/Bottom Layer
dialog:Use the drop-down menu to specify a location (Lower, Mid, or Upper) for the Top layer and Bottom layer.- Click OK to apply the settings/changes and exit the dialog.
- Click Apply to apply the settings/changes to the contour plot.
- Click Cancel to disregard the settings/changes and exit the dialog.
Figure 1. MaxLayer Contour Plot - Example 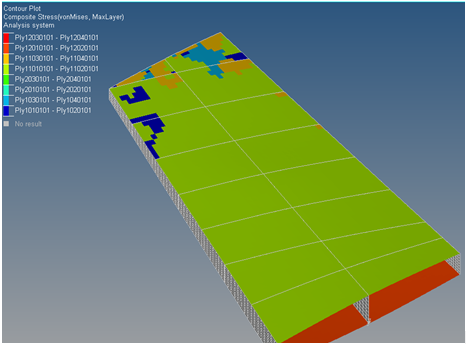
Note: The maximum, minimum, or extreme value can be queried using Quick Query, Query Panel, Measures, or from the Notes entry fields (in addition to the layer name). A Category Legend appears for each of these contour plots.Only in the case of results based at the elemental centroid, would one layer per element be displayed. For corner bound or nodal bound results (in the case of averaging), different layers may contribute to the max/min/extreme value at each corner/node of the same element.
See the Derived Load Steps topic to view a table which explains the behavior of layer aggregation (Min/Max/Range) in combination with the Min/Max/Range Envelope loadstep types.