Using the Application Macro
Execute the application macro in POSTFEKO to plot characteristic mode quantities on Cartesian graphs.
- Start with a POSTFEKO session containing at least one model with characteristic mode analysis results.
The results from a single characteristic mode analysis request will be used
as input to the macro.
-
Execute the Plot characteristic modes
application macro in POSTFEKO
to plot the characteristic modes.
Figure 1. The Characteristic Mode Plotter dialog. 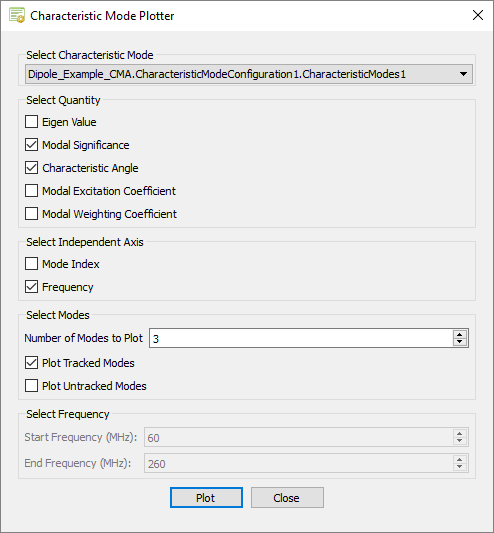
A dialog shows the available characteristic mode results. -
Select the result and quantities of interest.
Restriction: The Modal Excitation Coefficient and Modal Weighting Coefficient can only be plotted when the model contains a source and the modal excitation coefficient calculation is enabled in the request.
-
Select Frequency, Mode Index, or
both as the independent axis.
A new graph for each selected independent axis will be created for each quantity of interest.
-
Enter the highest mode index to be considered. This determines the number of
modes that are plotted on each graph.
A trace is added to each graph for each calculated mode with an index lower or equal than the entered value.
- Select to plot either the Tracked Modes, the Untracked Modes, or both.
- Select Plot to start the plotting on a Cartesian graph.
-
View the graphs generated by the macro.
Figure 2. Modal significance graph for a simple dipole antenna. 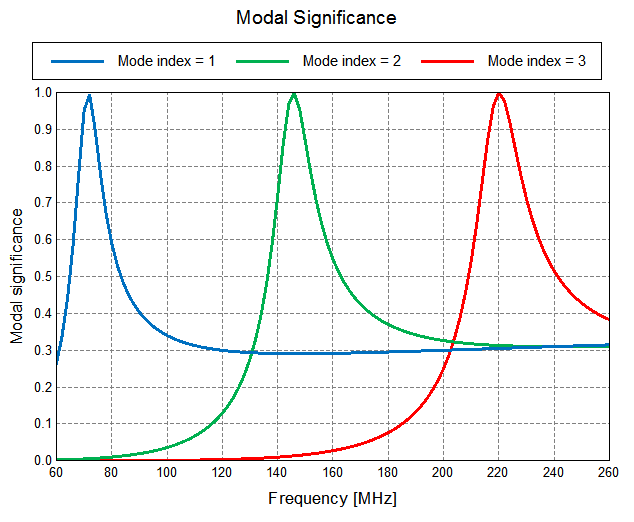
Figure 3. Characteristic angle graph for a simple dipole antenna. 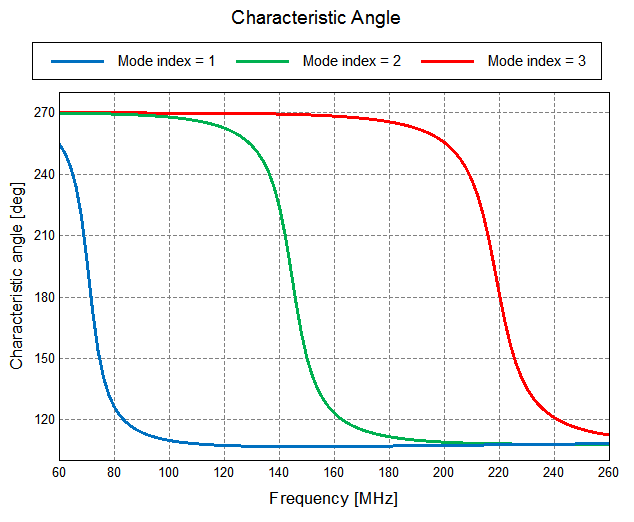
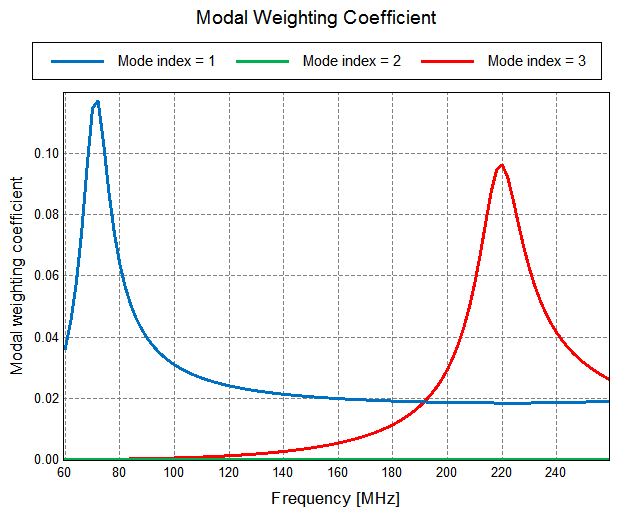
Figure 4. Modal weighting coefficient graph for a simple dipole antenna.