Configured Nodes on an Appliance
Monitor and manage all compute nodes in the appliance, including their status, configuration, and resource utilization.
- Click Appliances in the left navigation pane.
- Click the appliance Name link to view its configuration and resource usage details.
-
Click Nodes to view its configured nodes.
Figure 1. Nodes 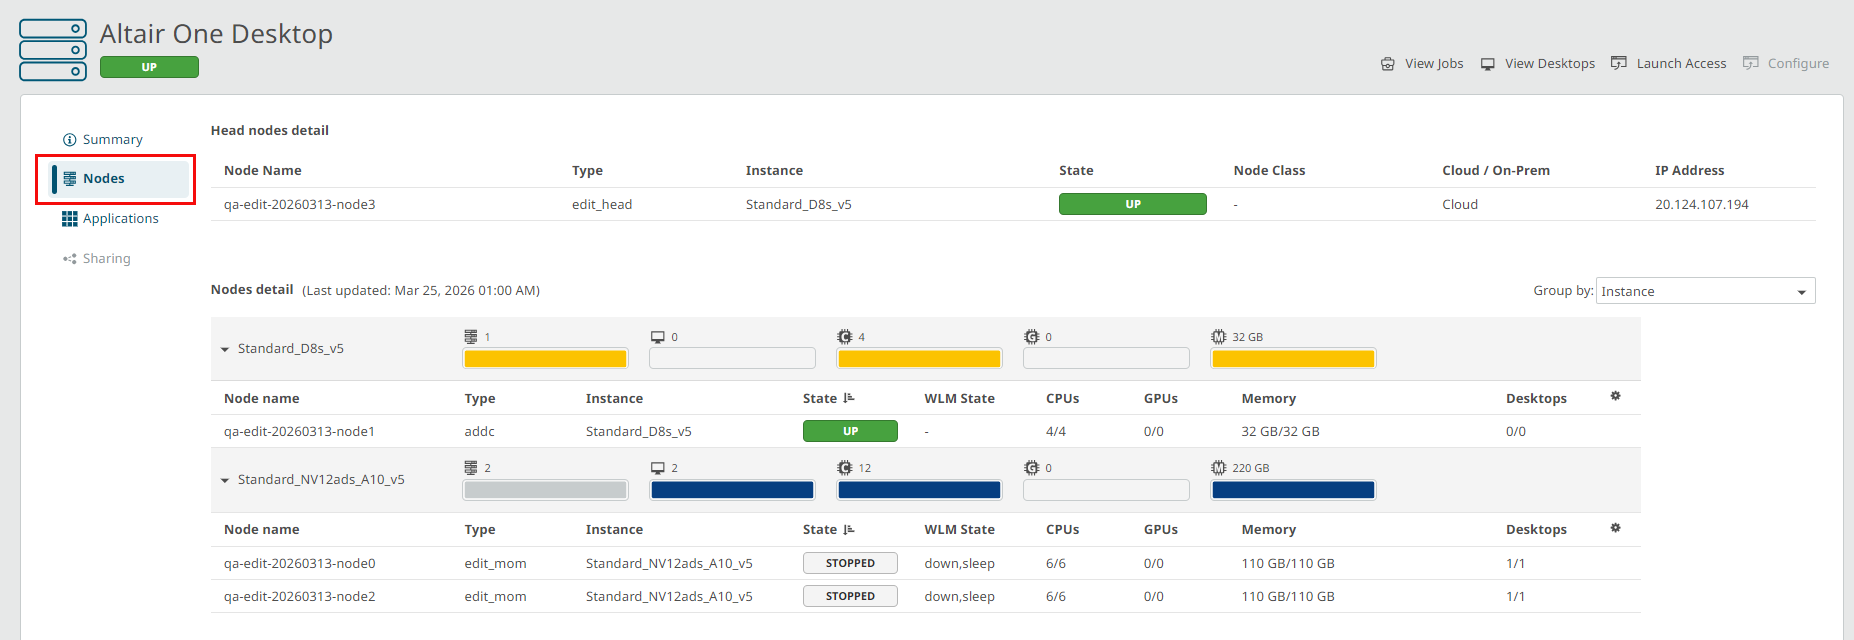
- Head node details represents the primary control node for the appliance. It manages scheduling, and overall system operations. Includes node name, instance type, current state, deployment location (cloud/on-prem), and IP address.
- Nodes detail provides a grouped view of all nodes by instance type (default view), along with the last updated timestamp. Helps track infrastructure changes and resource distribution across node types.
- Resource summary bars are the visual indicators of total and used capacity for resources such as nodes, desktops, CPUs, GPUs, and memory within each instance group.
- Node list table displays detailed, per-node operational data:
- Node name & Type displays a unique identifier node name and type.
- Instance: VM size or hardware configuration assigned to the node.
- State: Current availability status (e.g., UP, STOPPED).
- WLM State: Workload manager state indicating scheduling or activity status (e.g., active, down, sleep).
- CPUs / GPUs / Memory: Resource allocation and usage per node (used vs total).
- Desktops: Number of active versus available virtual desktop sessions.
- Click Group by list to view the Node detail table by node status or by none (all nodes under the primary node).