Graphs
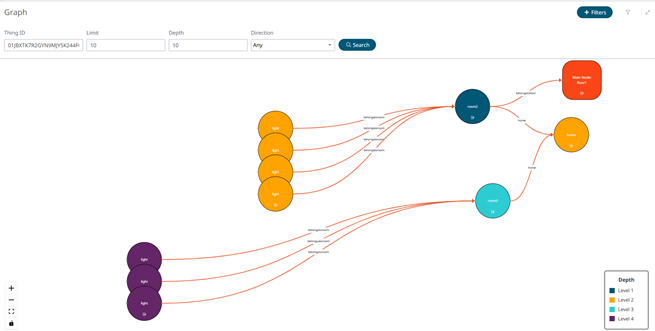
Graphs enable you to visualize the relationships between your Things to easily understand how different assets are linked within the connected ecosystem.
- Enter the ID of the Thing that represents the main node. The main node represents the specific asset you are currently exploring, with all related connections and nodes branching out from this point.
- Set a Limit. This defines the maximum number of connections or "nodes" displayed in the graph at once.
- Set the Depth. Depth specifies how many levels of relationships are shown starting from the main node.
- Choose the Direction. Direction refers to the way connections are displayed, indicating whether relationships are outgoing (OUTBOUND), incoming (INBOUND), or bidirectional (ANY).
-
Click Search to display the graph visualization.
Figure 1. 
You have the ability to add filters, allowing you to narrow down the
displayed nodes and focus only on specific ones, or relationships that are most
relevant to your analysis.
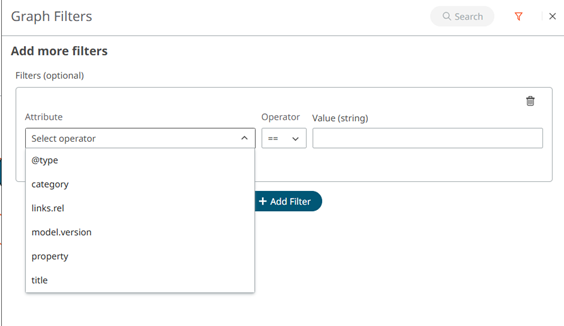
- Click + Filters to include Graph Filters.
-
Click on + Add Filters and fill in the required
information. You can add as many filters as you want.
Figure 2. 
- Attribute: This refers to the specific characteristic of the asset that you want to filter by.
- Operator: Defines the condition you want to apply to the attribute, to specify how you want to compare the attribute to the value.
- Value: This is the specific criteria you are looking for. The combination of attribute, operator, and value allows you to tailor the graph to display only the data you need.
- Click Search to apply the filters.