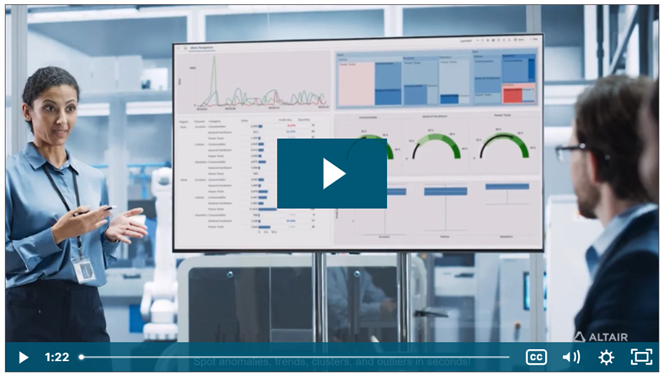
Real Time Visualization
Real Time Visualization offers down-to-the-second data (real-time), automatically updating charts with anomaly detection and user feedback functions.
With this solution you can see the Data how you want, where you want, and fast enough to act quickly.
This tool is powered by Altair Panopticon and supports a wide range of information visualizations, including our well-known Treemaps, Heat Maps, Scatter Plots, Horizon Graphs, and a wide range of other great visualizations designed for fast comprehension and easy interpretation of static, time series, real-time streaming, and historic data sets. Current running version is 2024.1.
Watch the video below for more information about Real Time Visualization:

The documentation for Panopticon Designer (and therefore for Real Time Visualization) can be found here.