The Simulation page allows you to visualize the simulation of a specific Mission
related to a specific Product once you have created and defined a Mission.
To visualize a simulation:
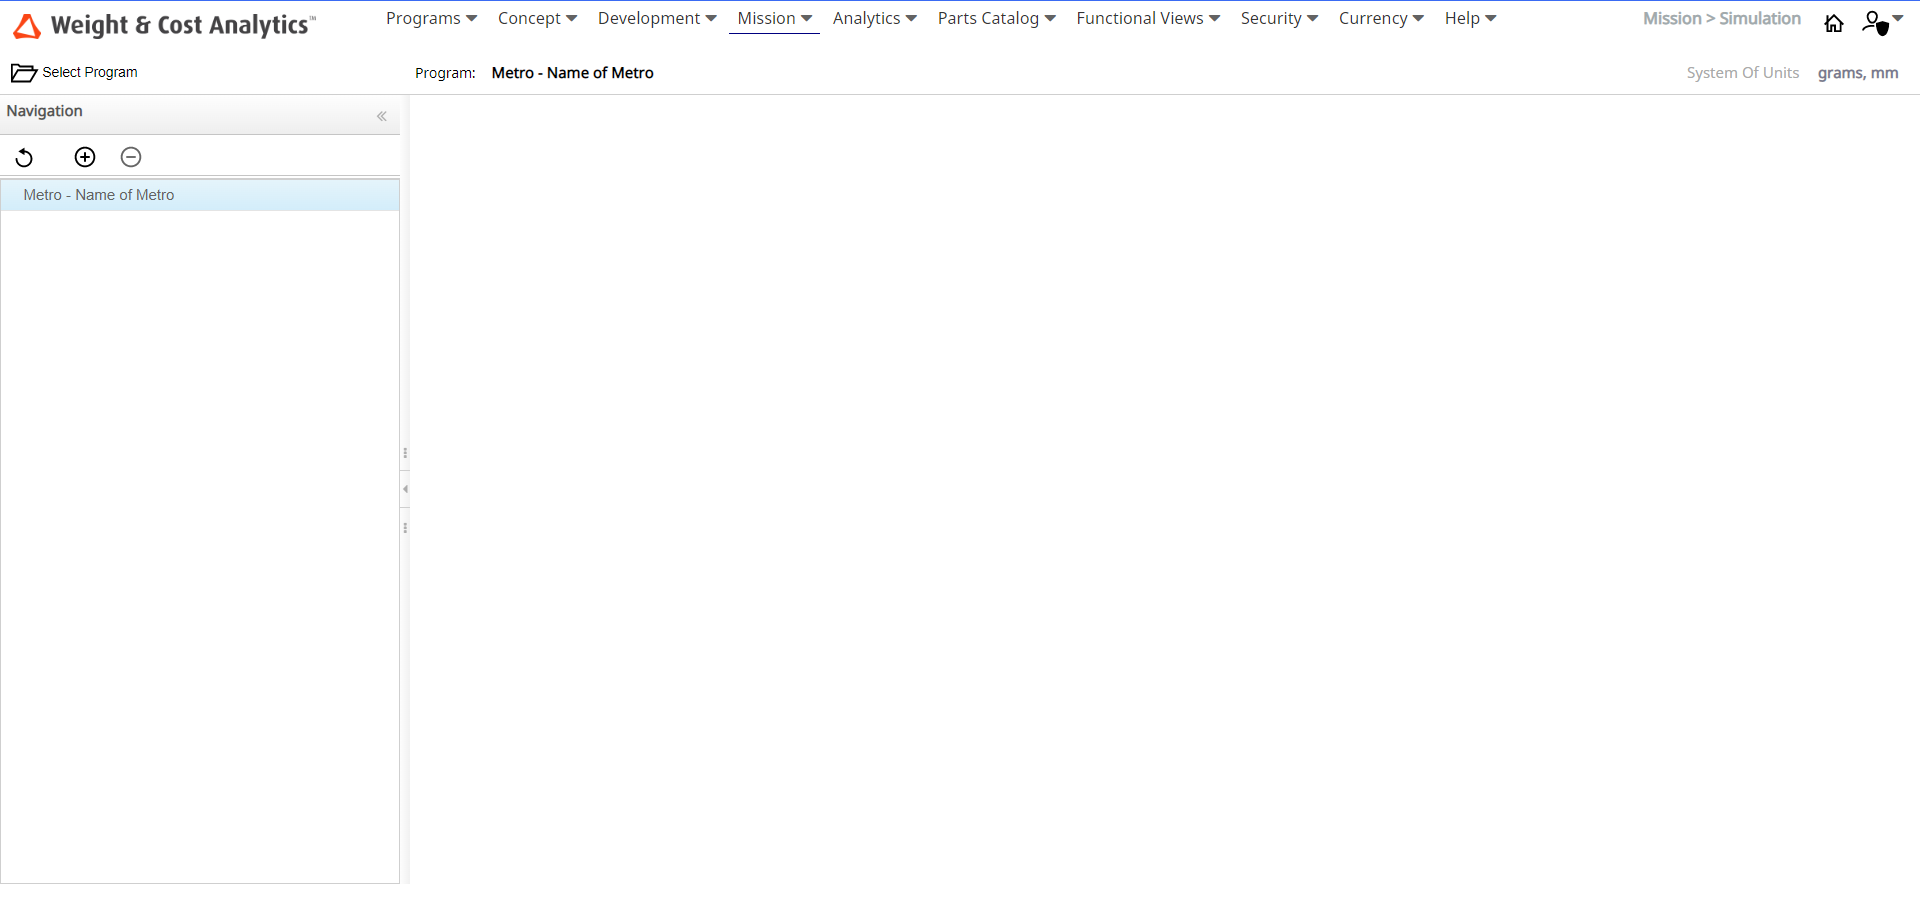
The Simulation page is shown in the following
image.
When a simulation already exists in the session, the Simulation page is populated with the simulation and in
respective tables.
The Simulation page allows you to:
Reload the Program tree in the navigation panel.
Add a simulation to the Program.
Remove a simulation from the Program.
Export a report of an existing simulation.
View and edit the simulation data.
View the graphics impact related to the simulation attributes.
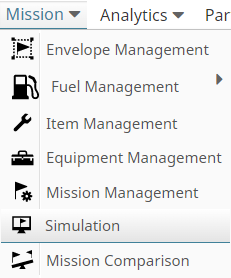
Click Mission > Simulation
The Simulation page is displayed.
Click the Add Simulation icon.
The simulation data is populated in the Main Attributes tab along with other tabs.
Click the Enable Changes icon.
The text field in the Main Attributes tab become editable.
Select the mission code name from the Mission dropdown list.
Enter the mission description in the Description text field.
Enter the required notes in the Notes text field.
Click the Select Product icon.
The Product Selection window is displayed.
Note: The Product Selection window displays only the Program and Products which has permissions. When
you select a Product without a Concept/Snapshot, Envelope, and Fuel law, the
Snapshot, Envelope, Fuel Law and Mission Equipment dropdown lists
will be empty.
Select the required Product and click Select Product.
Select the required Snapshot, Envelope, Fuel Law and a Mission Equipment from
the respective dropdown lists.
All the task items is populated in the table.
Click the Save Changes icon.
A confirmation message is displayed.
Click OK to save the changes
or Cancel to discard the
changes.
Select the Lateral tab adjacent to the Main Attributes tab.
The graphics impact of the simulation in the lateral chart is
displayed.
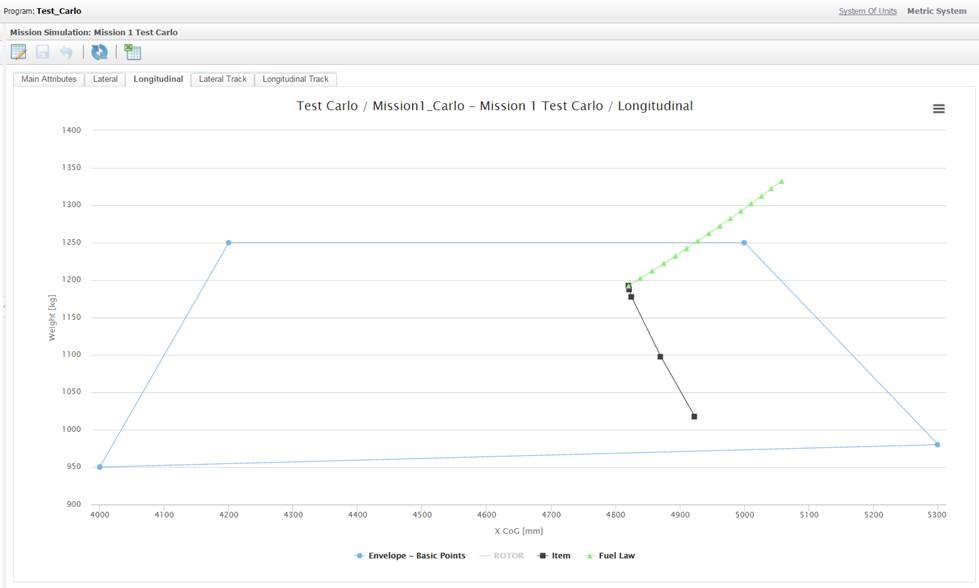
Note: You can view the graphics impact of the simulation in the
adjacent tabs (Longitudinal, Lateral track, Longitudinal track) based on the
attributes defined.
 icon.
The simulation data is populated in the Main Attributes tab along with other tabs.
icon.
The simulation data is populated in the Main Attributes tab along with other tabs.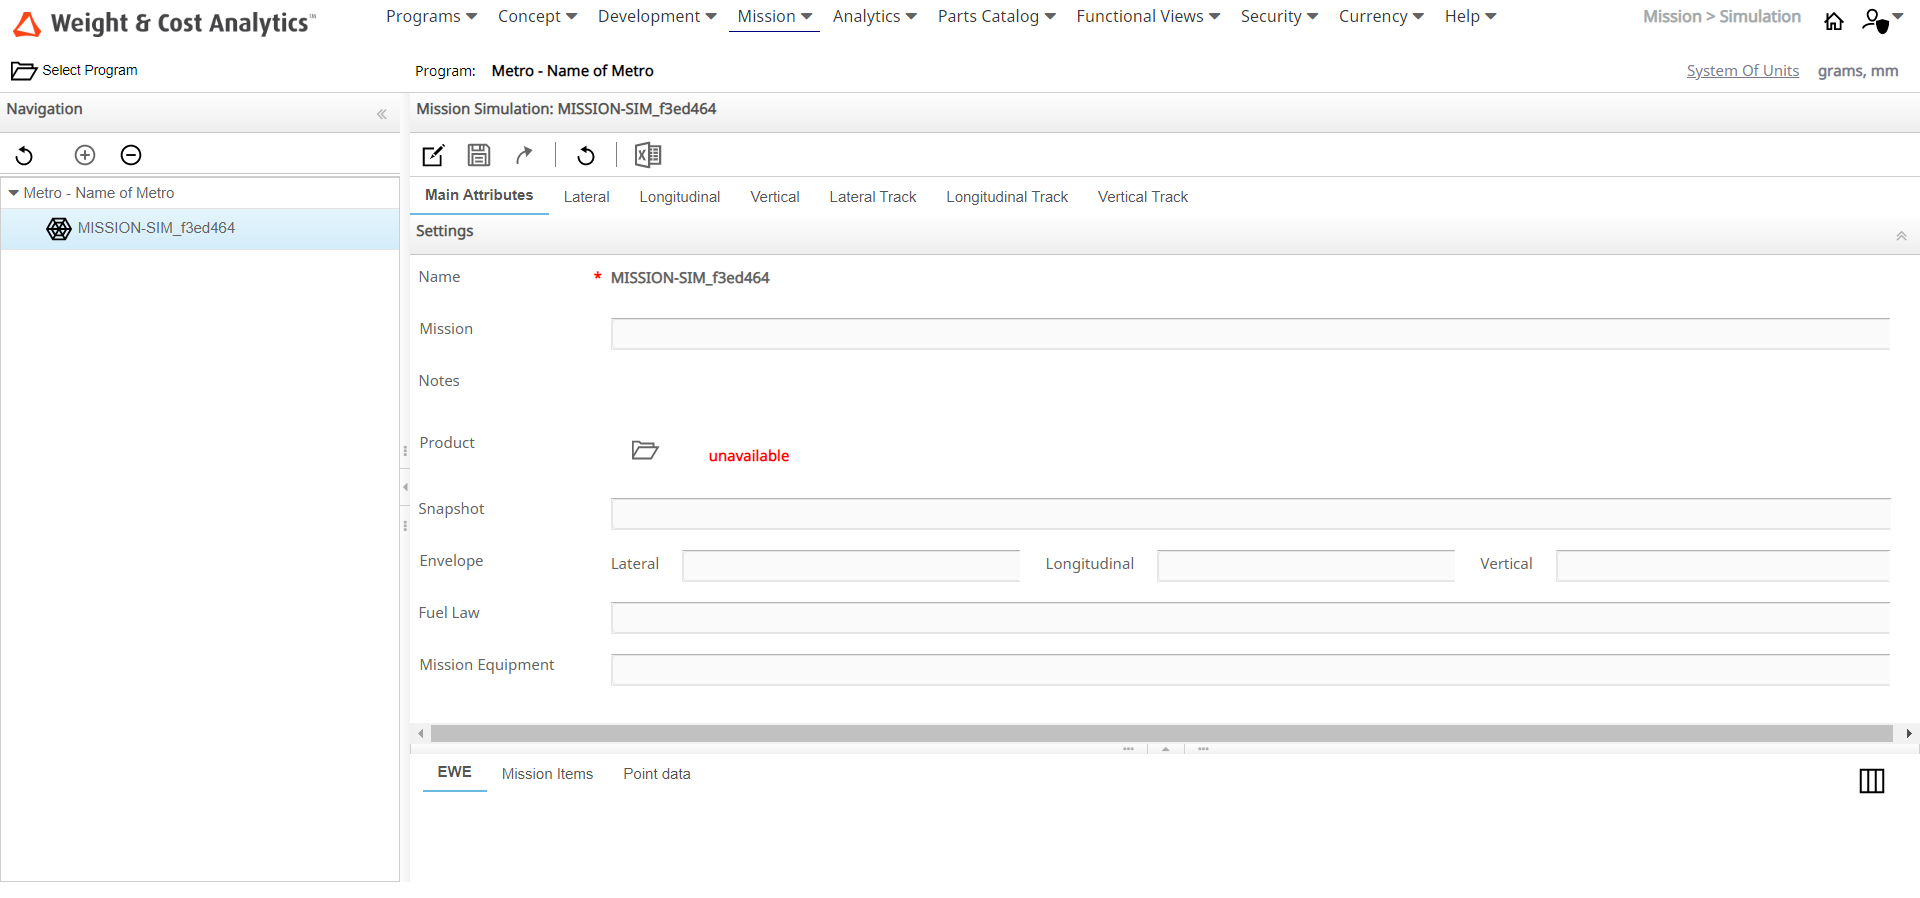
 icon.
The text field in the Main Attributes tab become editable.
icon.
The text field in the Main Attributes tab become editable.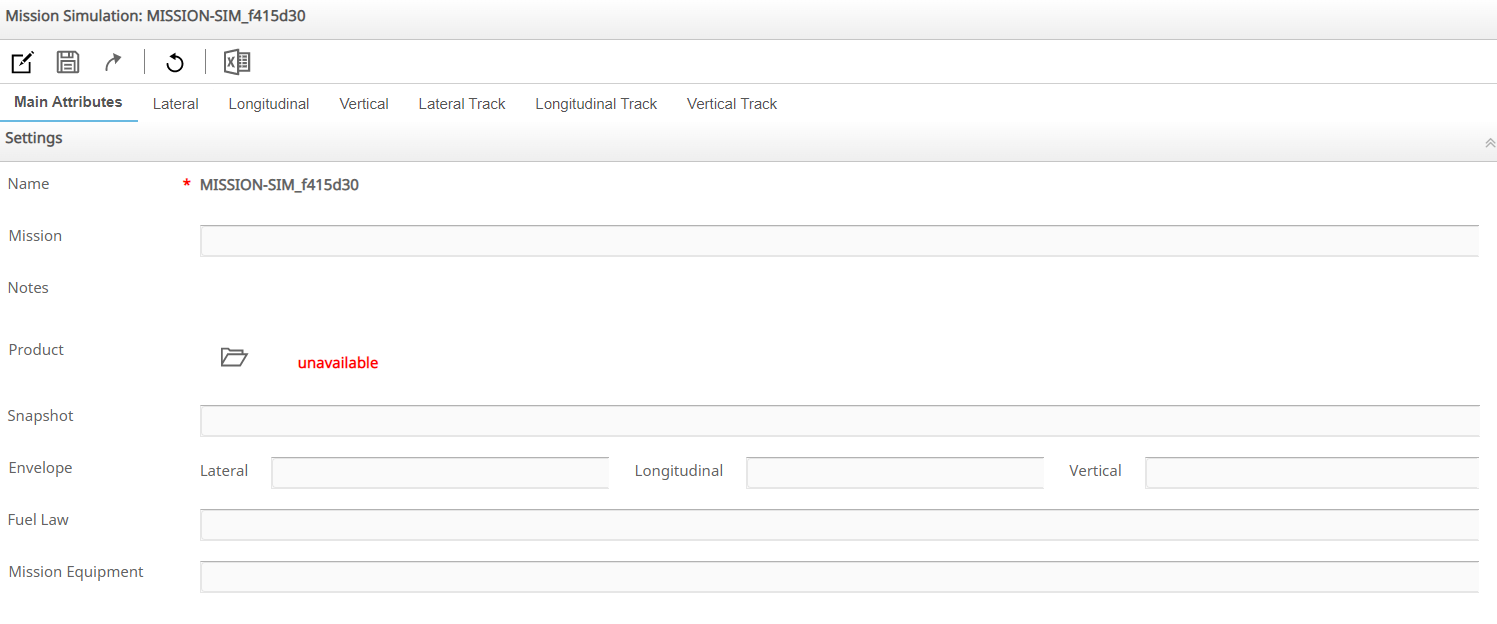
 icon.
The Product Selection window is displayed.
icon.
The Product Selection window is displayed.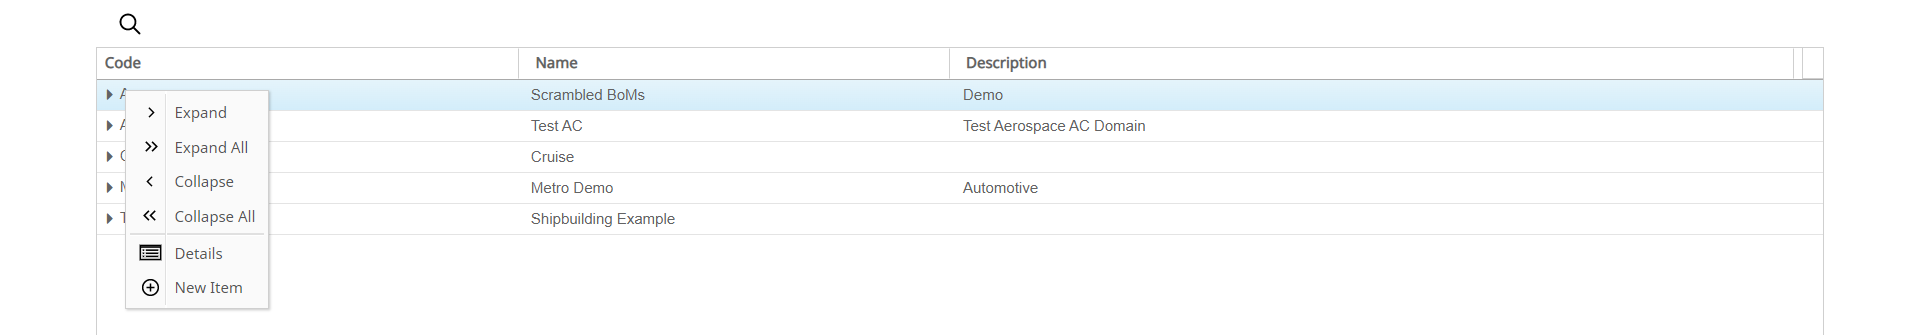
 icon.
A confirmation message is displayed.
icon.
A confirmation message is displayed. icon.
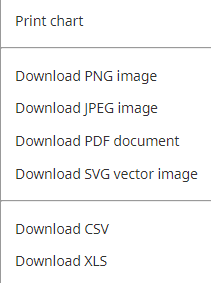
Select the required format to download the chart.
icon.
Select the required format to download the chart.