Efficiency map - Motor
1. Positioning and objective
The aim of the test “ Performance mapping – Sine wave – Motor – Efficiency map ” is to characterize the behavior of the machine in the "Torque-Speed" area.
Input parameters like the maximum “Line-Line voltage”, the maximum “line current” and the desired “Maximum speed” of the machine are considered.
Two types of command modes are available: The Maximum Torque Per Volt command mode (MTPV) and the Maximum Torque Per Amps command mode (MTPA).
Input parameters define torque-speed area in which the evaluation of the machine behavior is performed.
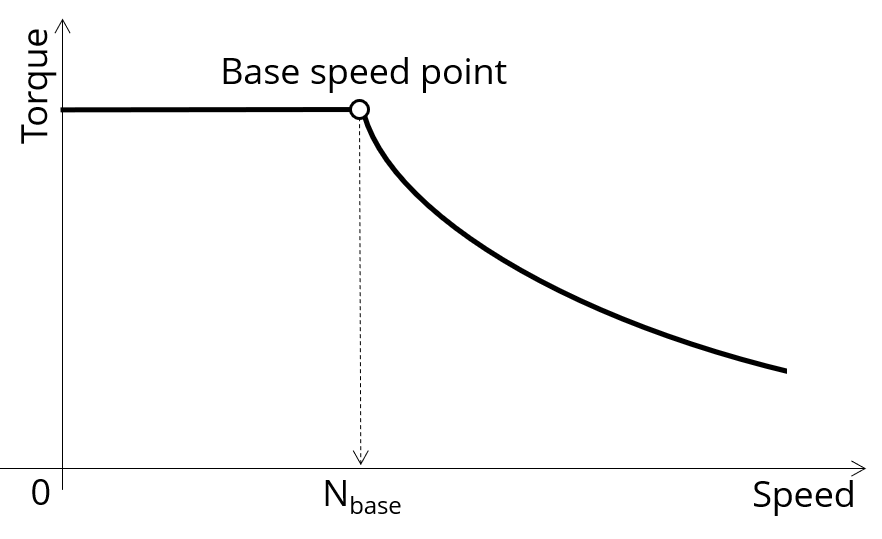 |
| Characterization of the corner point on the torque-speed curve |
In the results, the performance of the machine at the base point (base speed point) and for the maximum speed set by the user are presented.
A set of curves (like Torque-Speed curve) and maps (like Efficiency map) are computed and displayed.
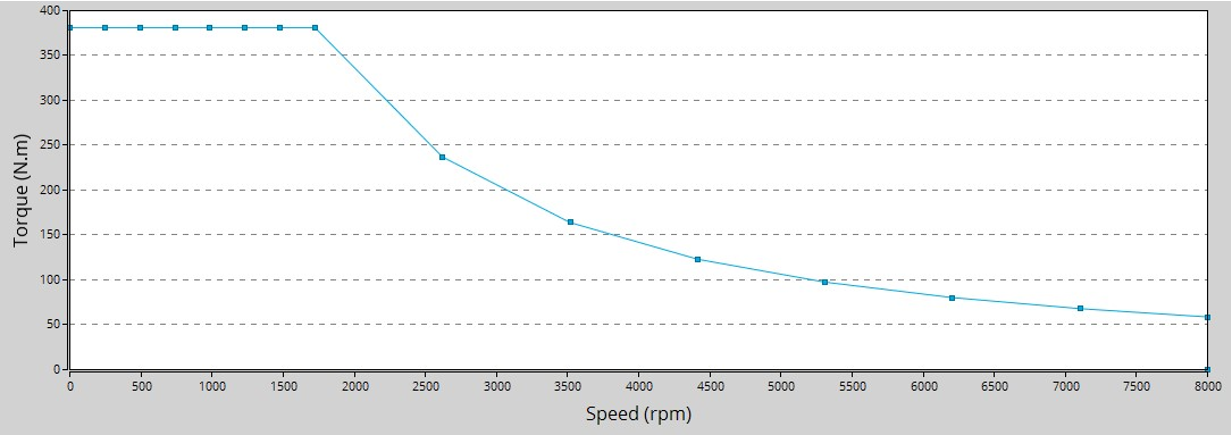 |
| Mechanical torque versus speed - Example |
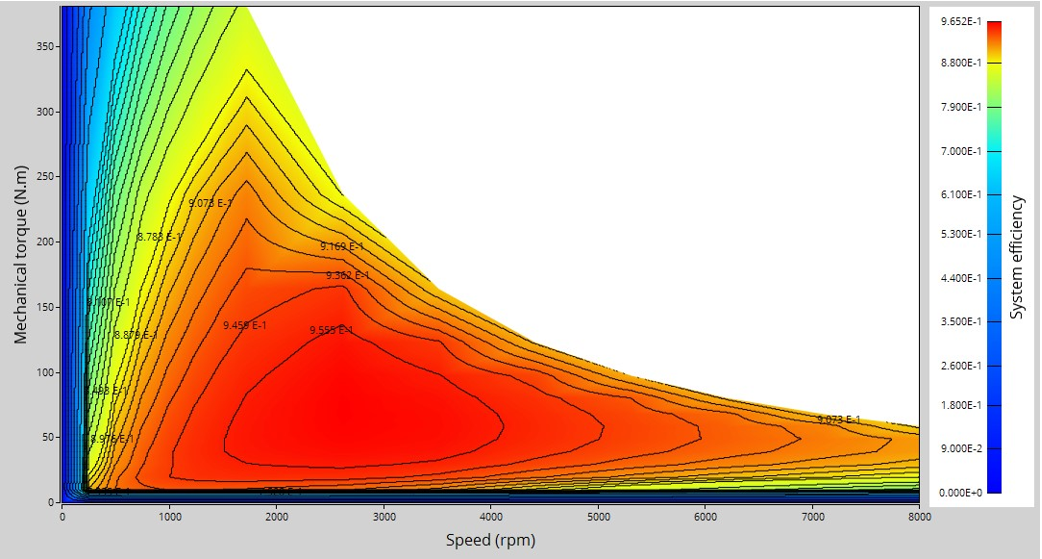 |
| Efficiency in torque-speed area - Example |
These results help the user to understand the possible performance of the machine in its electric environment.
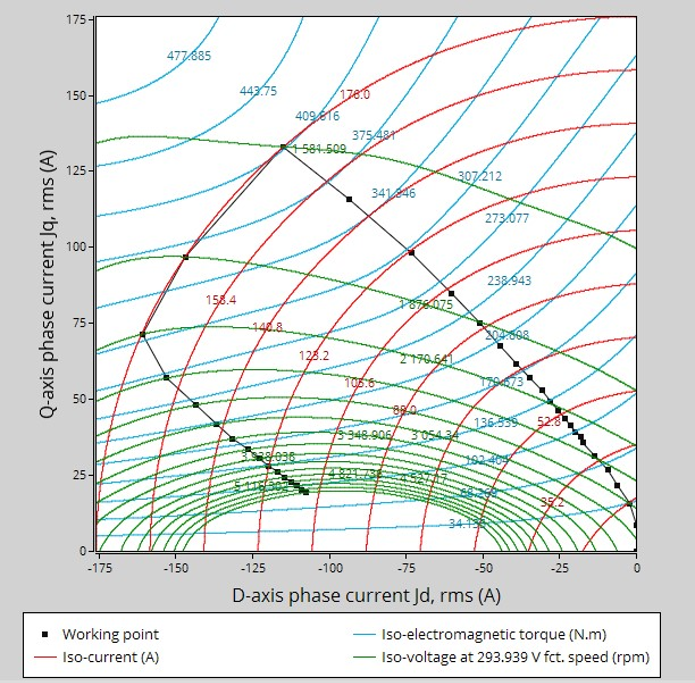 |
| Characteristics curves in J d -J q area - Example |
2. Driving cycle with or without thermal solving
2.1 Basic driving cycle
Two features are available in this test.
The first one allows extracting one torque-speed point from the efficiency map to get the machine performance, for this specific working point (general data + power balance).
Note: The considered working point is then displayed on all the maps available.
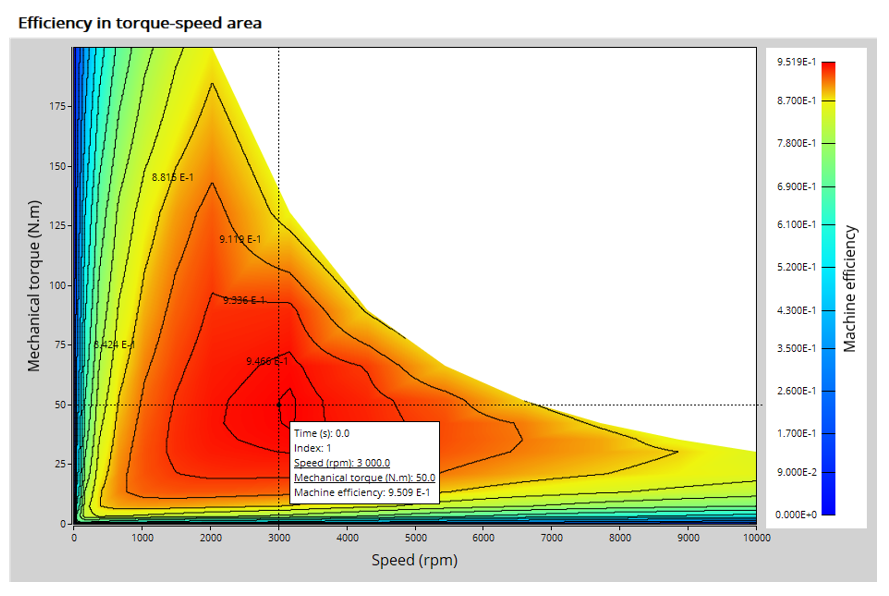 |
| A “single” working point displayed on the efficiency map - Example |
The second feature allows the user to define a duty cycle by giving a list of working points (speed, torque) versus the time. The displayed results illustrate the machine performance over the considered duty cycle (mean, min, and max values).
The time variation of the main quantities is also displayed (Mechanical torque, speed, control angle, current, voltage, power, efficiency, losses).
All the corresponding points are displayed on the different provided maps.
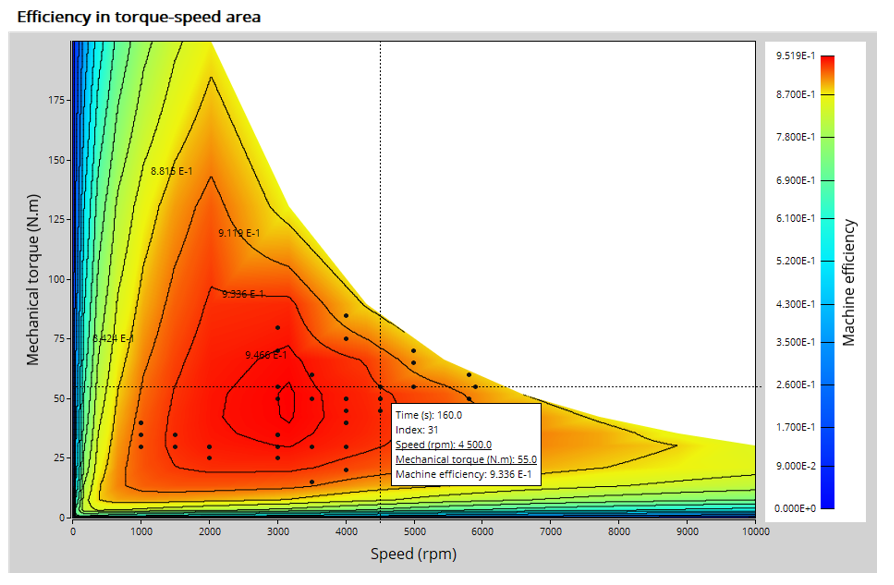 |
| A “Driving cycle” displayed on the efficiency map - Example |
2.2 Driving cycle with thermal solving
When the "thermal solving" is selected in the settings, the machine temperatures are computed over the driving cycle.
The variation of the machine performance are computed and displayed over all the driving cycle time.
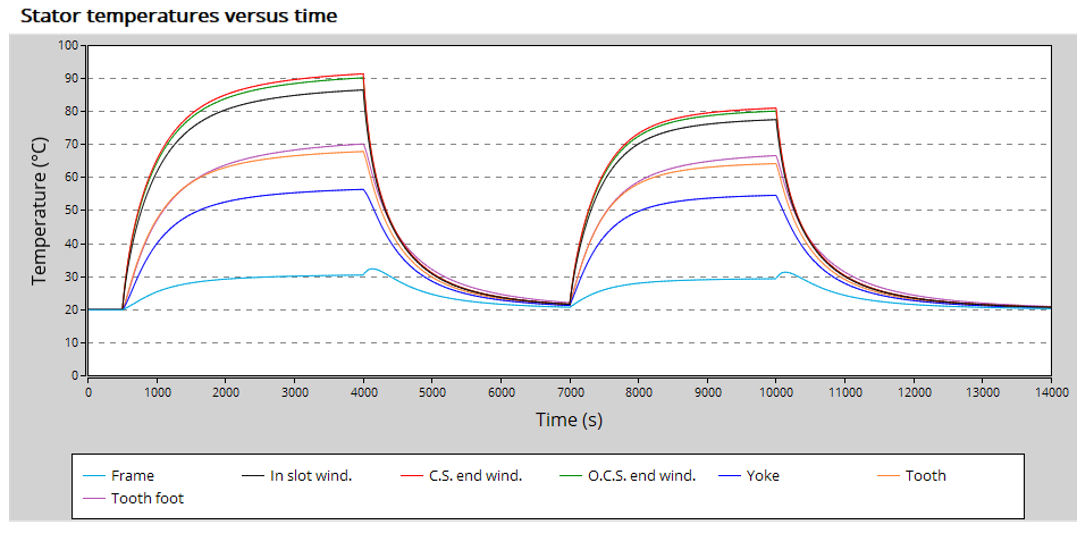 |
| The machine temperature variations can be evaluated all along the driving cycle |
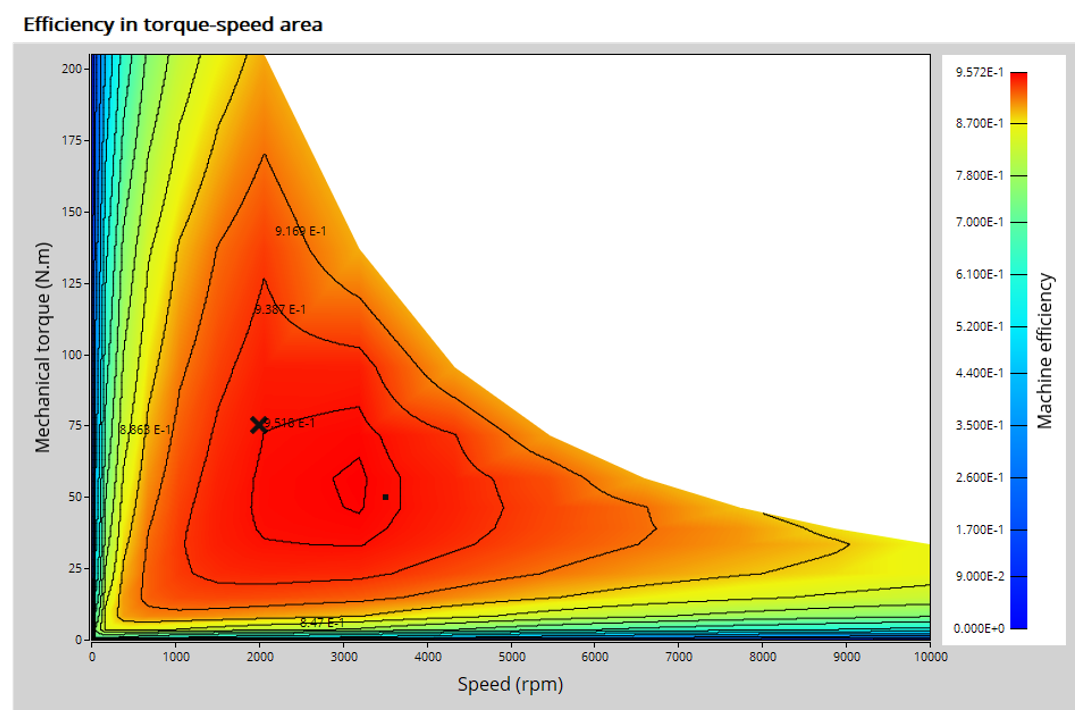 |
| A working point of the driving cycle can be selected for displaying the corresponding machine electromagnetic performance |
The following table helps to classify the test “ Performance mapping – Sine wave – Motor – Efficiency map ”.
| Family | Performance mapping |
| Package | Sine wave |
| Convention | Motor |
| Test | Efficiency map |
| Positioning of the test “Performance mapping – Sine wave – Motor – Efficiency map” | |
3. User inputs
The main user input parameters needed to perform this test are the maximum allowed supplied, line-line voltage, the line current, the targeted maximum speed and the command mode.
The thermal settings must be selected depending on how we want to define the winding and magnet temperatures.
When required, the location of the working points (single point or duty cycle) to be evaluated must be defined as inputs.
Three advanced user input parameters allow adjusting the compromise between accuracy and computation time: the number of computations for J d -J q , for speed and for torque.
4. Main outputs
Different kinds of outputs are displayed like data, curves, maps, and tables.
4.1 Main test results
-
Machine performance - Base speed point
- General data like torque, speed, electrical powers, control angle, efficiency etc.
- Power balance
-
Machine performance - Maximum speed
- General data like torque, speed, electrical powers, control angle, efficiency etc.
- Power balance
-
Machine performance - User working point (when requested)
- General data like torque, speed, electrical powers, control angle, efficiency etc.
- Power balance
-
Power electronics (when requested by the user)
- Inverter
- Base speed point - Power balance
- Maximum speed point - Power balance
- User working point – Power balance (when requested)
- Duty cycle - Power balance (when requested)
-
Machine performance - Duty cycle analysis (when requested)
- General data like torque, speed, electrical powers, control angle, efficiency etc.
- Power balance
- Energy balance
-
Thermal machine performance – Selected duty cycle working point (when requested)
- Machine, rotor, stator temperatures
- External and internal cooling temperature
-
Machine performance – over the duty cycle (when requested)
- General data like torque, speed, electrical powers, control angle, efficiency etc. (min., mean and max. values)
- Power balance
- Energy balance
-
Thermal machine performance – over the duty cycle (when requested)
- Machine, rotor, stator temperatures (min., mean and max. values)
-
Torque-speed curves
- Mechanical torque versus speed
- Current (J, Jd, Jq) versus speed
- Voltage (V, Vd, Vq) versus speed
- Control angle versus speed
- Power (Mechanical power, machine electrical power, system electrical power) versus speed
- Power factor versus speed
- Losses versus speed (total machine and system, Joule, iron, mechanical, additional, power electronics)
-
Characteristic curves
- Electromagnetic torque versus current and control angle (Y) according to base speed point
- Characteristic curves in Jd-Jq area - Evolution of the working points in Jd-Jq plane, with iso-torque, iso-current and iso-voltage.
-
Torque-Speed maps
- Efficiency in torque-speed area
- Current (J, Jd, Jq) in torque-speed area
- Voltage (V, Vd, Vq) in torque-speed area
- Control angle in torque-speed area
- Power in torque-speed area (Mechanical power and electrical power) in the torque-speed plane
- Power factor in torque-speed area
- Losses in torque-speed area (Total, Joule, Iron, Mechanical and additional) in the torque-speed plane
-
Duty cycle curves (when requested)
- Speed versus time
- Efficiency versus time
- Mechanical torque versus time
- Current (J, Jd, Jq) versus time
- Voltage (V, Vd, Vq) versus time
- Control angle versus time
- Power versus time (Mechanical power and machine and system electrical power)
- Power factor versus time
- Losses versus time (Total, Joule, Iron, Mechanical and additional
- Stator resistance versus time
- Magnet remanent induction versus temperature
- Main machine temperatures versus time
- Stator temperature versus time
- Rotor temperature versus time
-
Graphic displaying
- Machine temperature radial view versus time
- Machine temperature axial view versus time