View Scatter Plot
Visualize the correlation and interdependency between two properties data. The independent property data is plotted on X-axis while the dependent property data is plotted in Y-axis.
-
Click Scatter Plot.
 Figure 1. Scatter Plot on Action RibbonThe Scatter Plot panel is displayed.
 -
Select the X and Y properties for which you wish to plot.
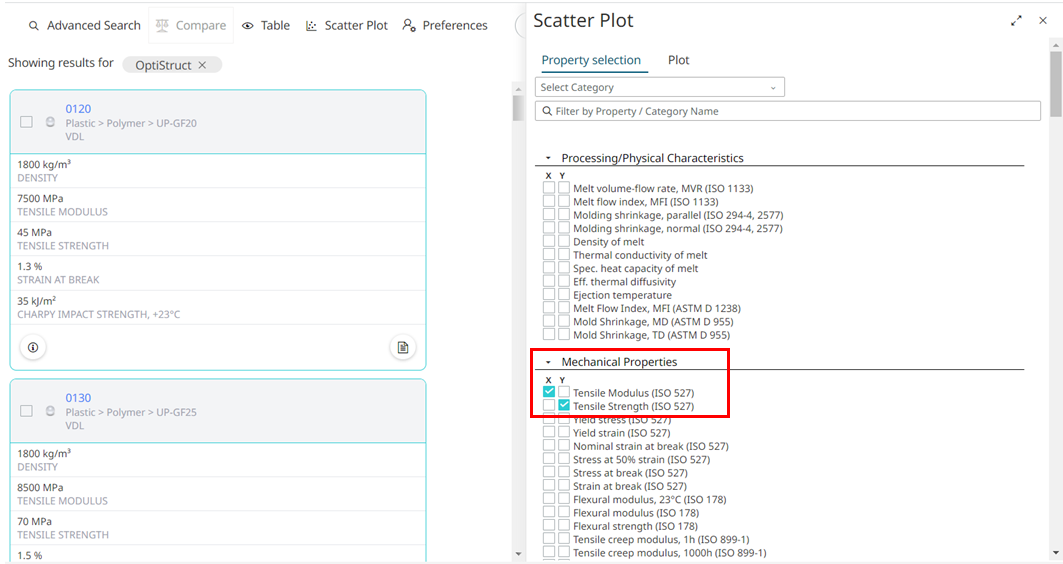
Figure 2. Select Properties -
Click Plot.
The Scatter plot for the selected materials is displayed. The dot displaying the correlation of the material properties.
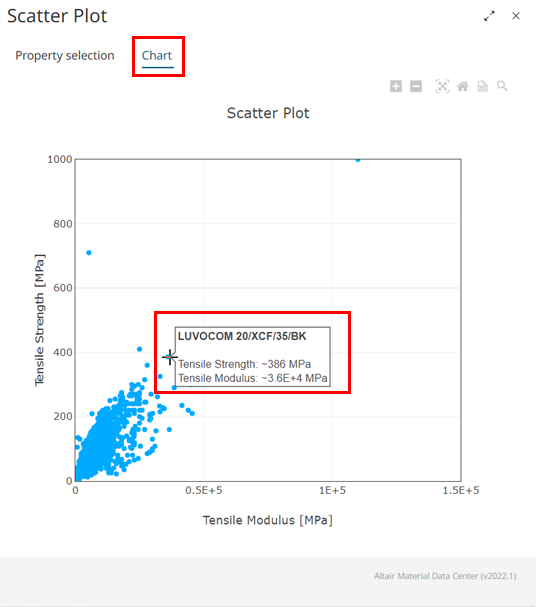
Figure 3. Scatter PlotDrag a rectangle on the plot area to zoom in to plotted area.
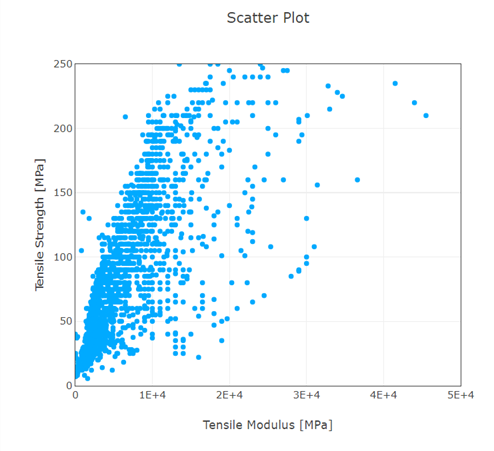
Figure 4. Zoom inHover over the plot area to view chart options such as zoom in, zoom out, auto scale to original plot view, reset axes, and export it as a PDF document.