Network Planning
Whether the scenario is indoor, urban or rural, a network planning simulation can be regarded as post-processing of a propagation simulation.
The preparations in WallMan and AMan are exactly the same as for a regular propagation simulation.

For network planning, the air interface (for example, CDMA, OFDM) are to be defined with parameters related to carriers (number, bandwidth, separation), transmission modes, coding, required signal-to-noise-and-interference ratio at the receiver. This information may be loaded from a file with extension .wst or defined manually.

This menu item brings up a window with several tabs: those from the regular propagation analysis, and additional ones that are specific to network planning. If you have loaded an existing .wst file, then most or all information necessary for the network-planning part of the simulation has already been filled in under the relevant tabs.
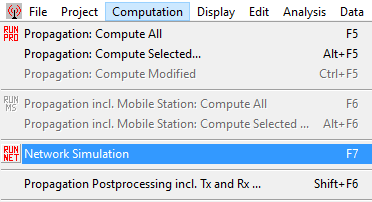
A network-planning analysis starts with a regular propagation analysis, launched through the RUN PRO button or the Computation menu. This provides results like received power over the area of interest. The network-planning post-processing is launched through the RUN NET button or the Computation menu.

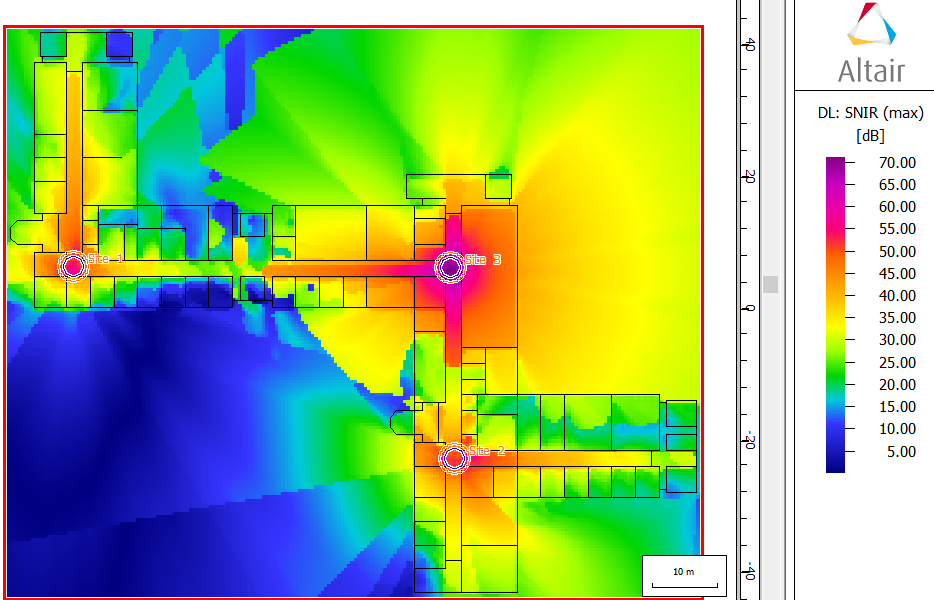
The network-planning simulation adds results like signal-to-noise-and-interference ratio (SNIR), cell assignment, maximum data rate, maximum throughput, coverage probability. At every location in the area of interest, whether one can communicate with a particular air interface and data rate depends on the minimum required received power and minimum required SNIR.
