Viewing the Prediction Results
Display the results from the network planning simulation.
-
View the cell area to determine which site is received best (depending on the
location and defined settings).
-
In the tree, expand
 Results: Network to view the network planning
results.
Results: Network to view the network planning
results.
-
In the tree, click
 Cell Area to determine which site is received
best.
Cell Area to determine which site is received
best.
Figure 1. The cell area showing which site is received best for each receiver pixel. 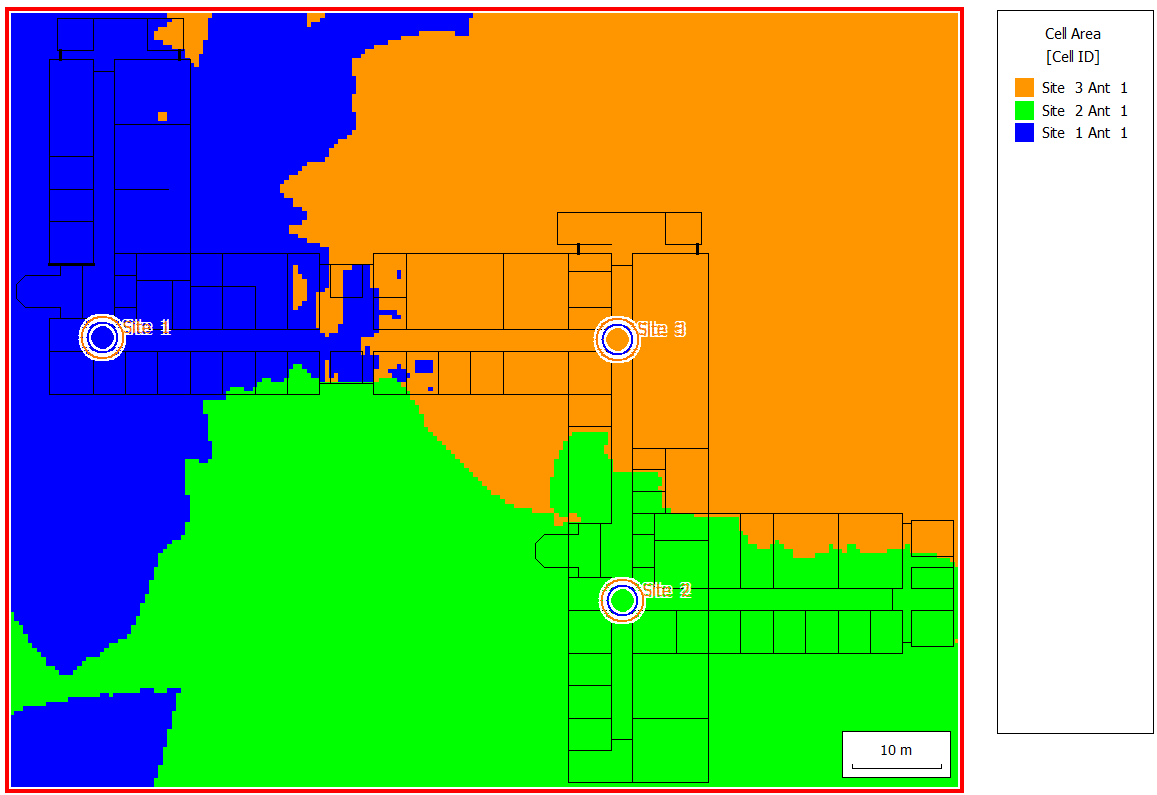
-
In the tree, expand
-
View the best server for each receiver pixel.
-
In the tree, expand
Results: Network to view the network planning
results.
-
In the tree, click
Best server to determine the best server for each
receiver pixel.
Figure 2. The best server result for each pixel. Note that Site 1 and Site 2 use the same carrier. 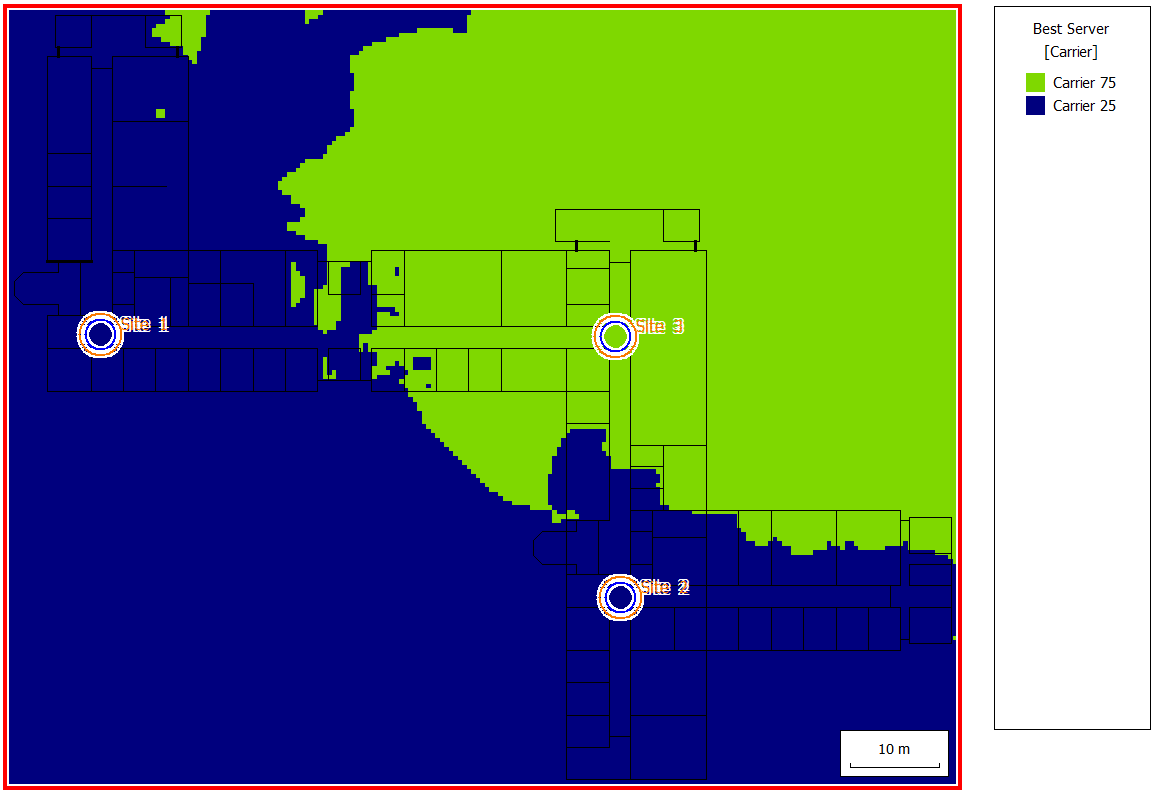
-
In the tree, expand
-
View the received power for cell assignment.
-
In the tree, expand
Results: Network to view the network planning
results.
-
In the tree, expand
 Cell Assignment and click
Received Power.
Cell Assignment and click
Received Power.
Figure 3. The received power for the cell assignment. 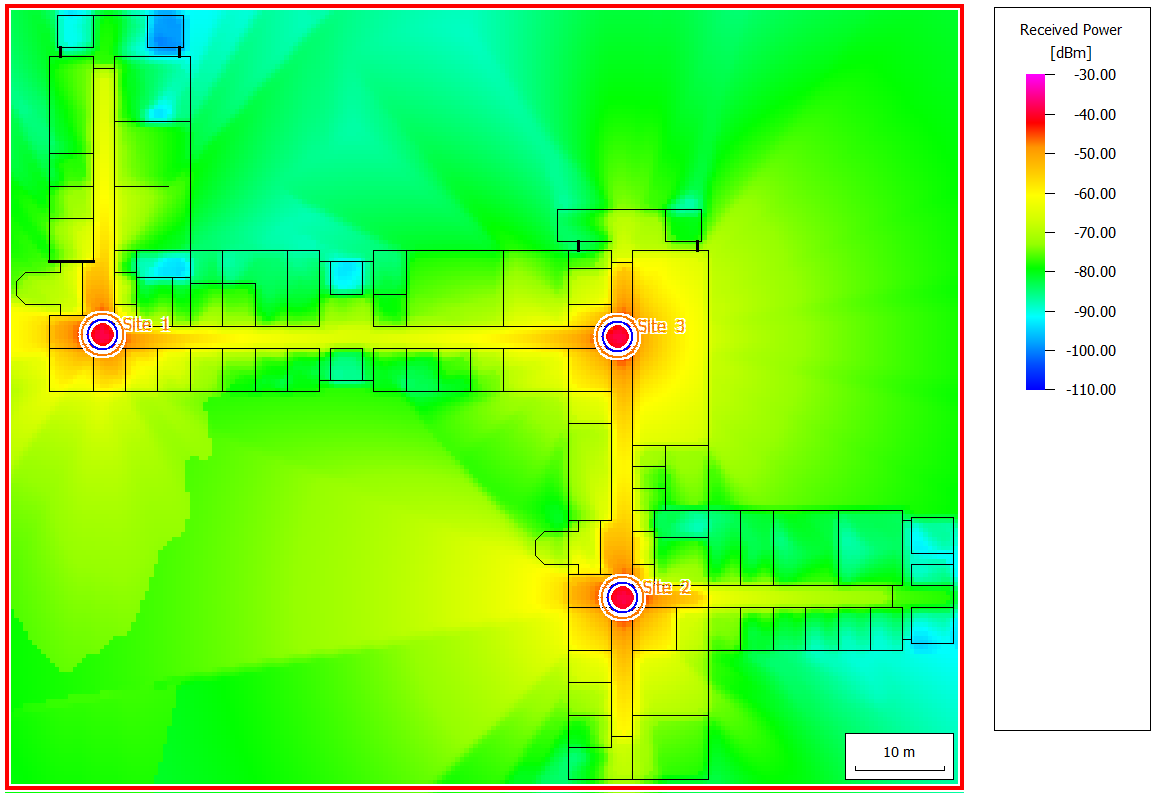
-
In the tree, expand
-
View the Signal-to-Noise-and-Interference Ratio (SNIR).
-
In the tree, expand
Results: Network to view the network planning
results.
-
In the tree, expand
Cell Assignment and click
DL: SNIR (max).
Figure 4. The SNIR is low in the lower-left quadrant. 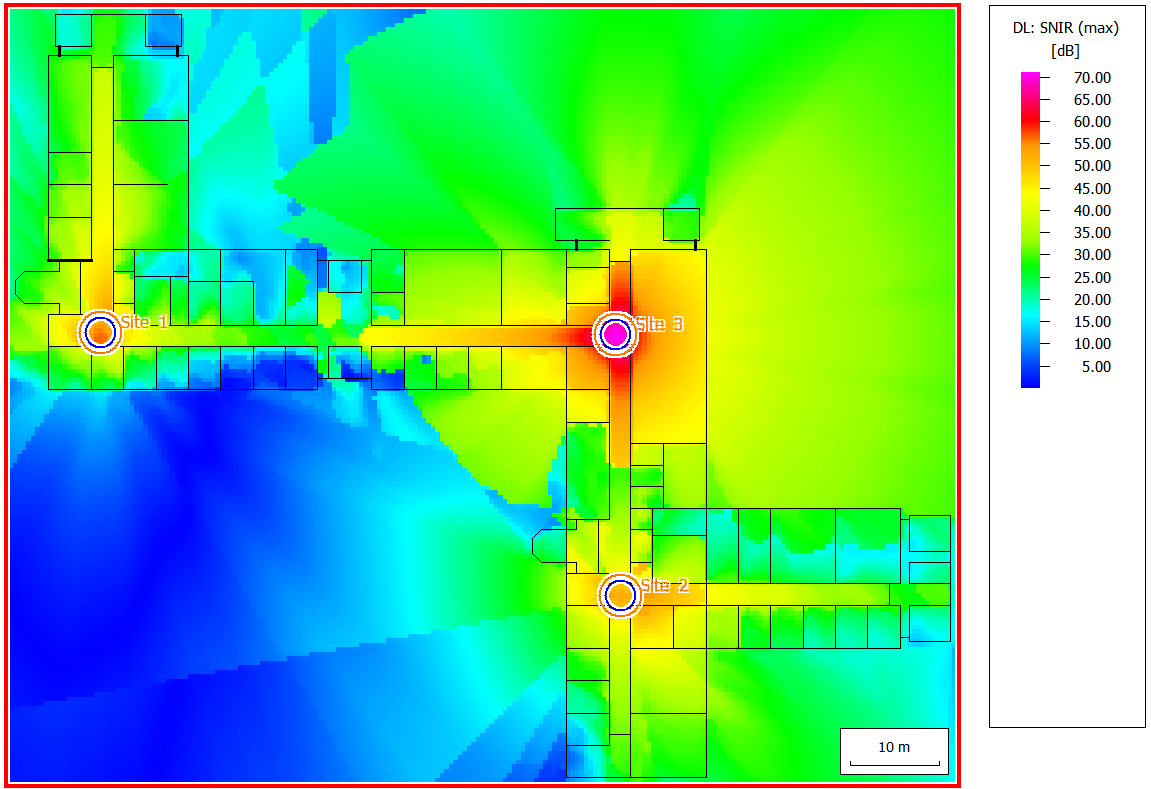
-
In the tree, expand
-
View the interference results.
-
In the tree, expand
Results: Network to view the network planning
results.
-
In the tree, expand
Cell Assignment and click
 Pilot: Interference.
Figure 5. The interference in the lower-left quadrant is high because Site 1 and Site 2 are on the same carrier. 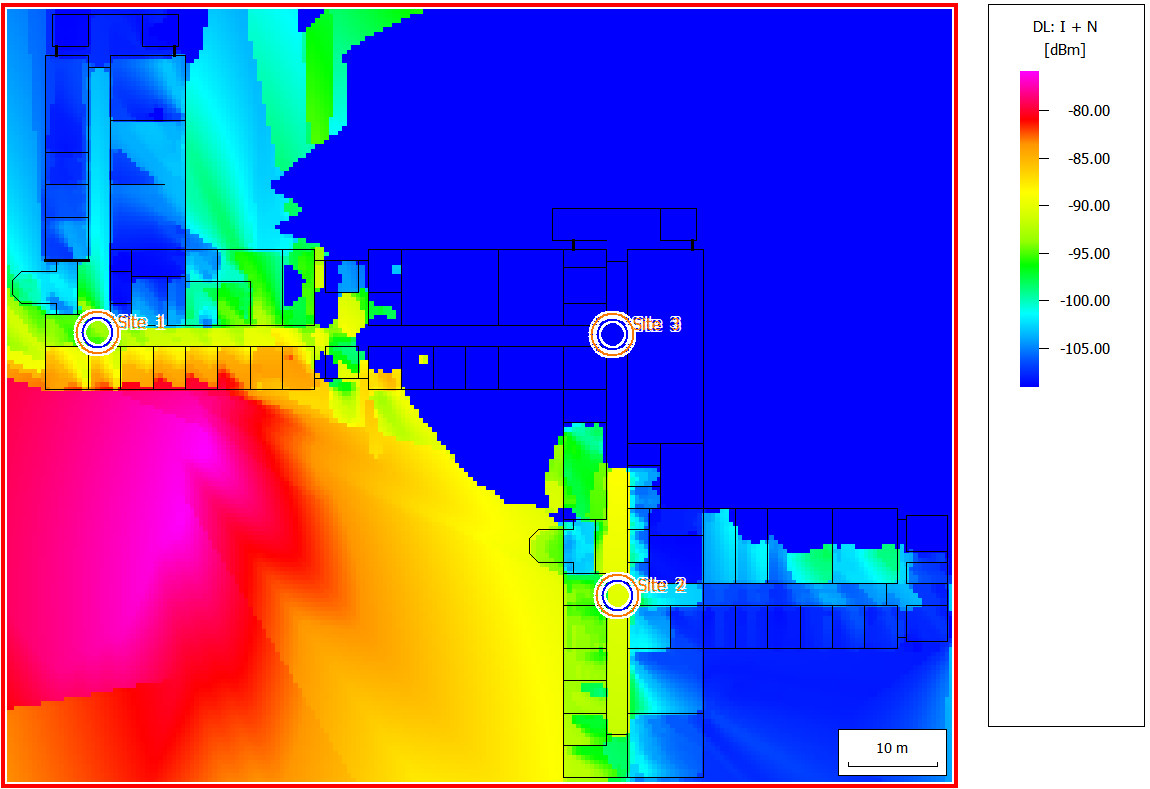
The interference occurs because both sites emit an individual signal on the same frequency. This can be changed by either assigning different carriers or by keeping the same carriers but making them transmit the same signal, so the signal from one is no longer the interference of the other.1 -
In the tree, expand
-
View the minimum transmit power to determine if the chosen modulation scheme
can be used.
-
In the tree, expand
Results: Network to view the network planning
results.
-
In the tree, expand
 64 QAM - R=3_4 and click
DL: Min Tx Power BS.
64 QAM - R=3_4 and click
DL: Min Tx Power BS.
Figure 6. In white areas, the chosen modulation scheme cannot be used (a slower one may still work). 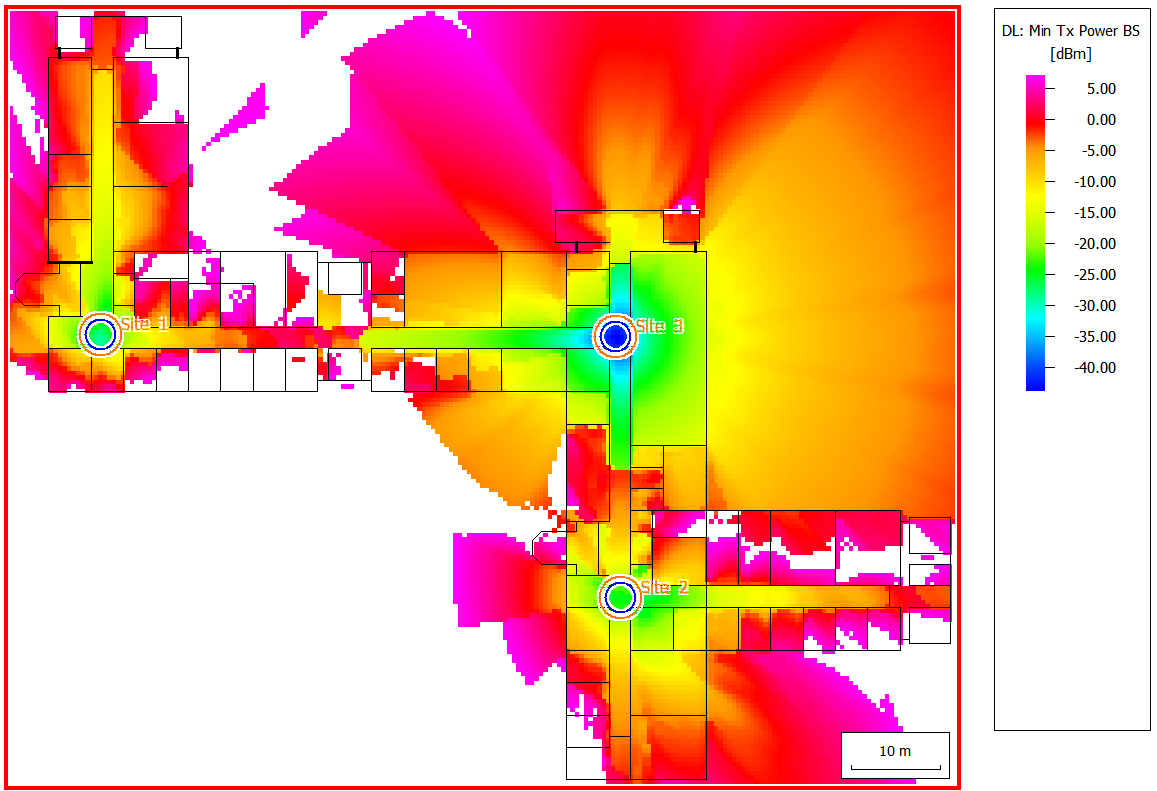
-
In the tree, expand
-
View the data rate to determine if communication is possible for the chosen
scheme.
-
In the tree, expand
Results: Network to view the network planning
results.
-
In the tree, expand
64 QAM - R=3_4 and click
DL: Data Rate.
Figure 7. In non-white areas, communication can take place at the data-rate of the chosen scheme. 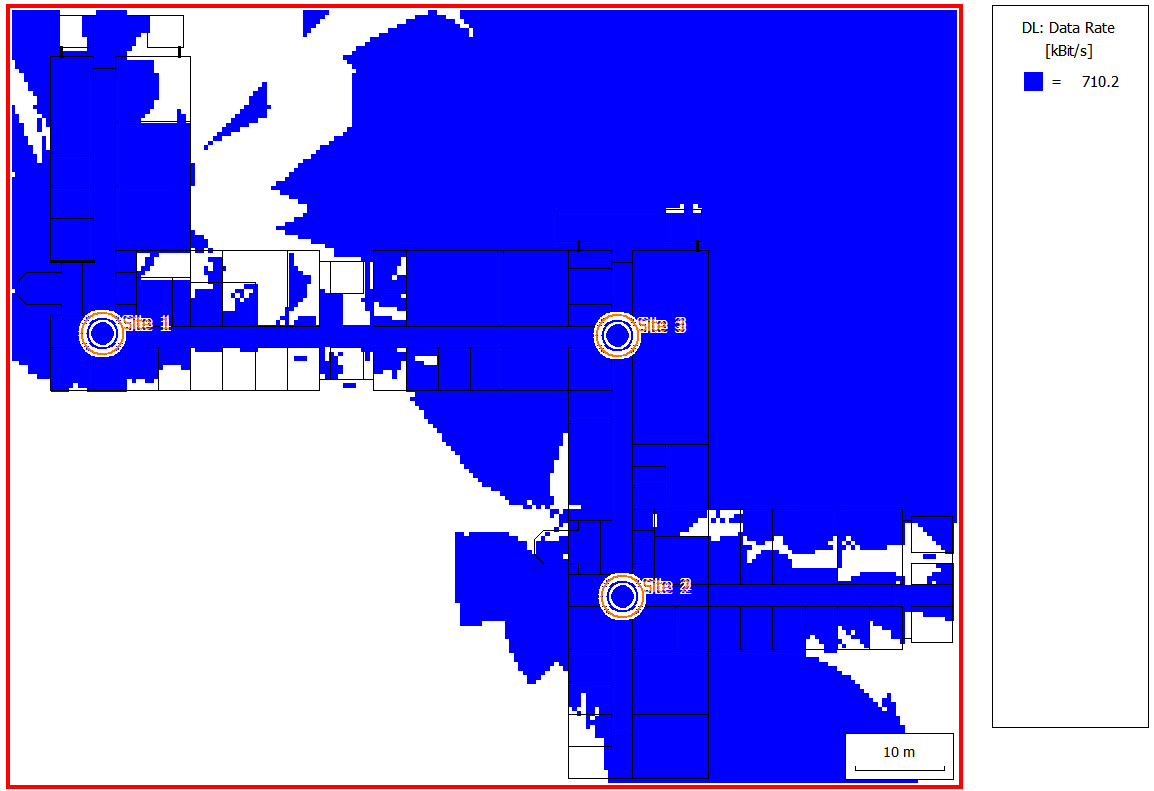
-
In the tree, expand