Viewing the Prediction Results
Display the power results using the dominant path model (DPM).
-
View the power using the DPM for
the base station located on the highest hill.
-
In the tree, expand
 Results: Propagation to view the results for the
two base stations.
Results: Propagation to view the results for the
two base stations.
-
In the tree, expand
 Highest_45 to view the base station on the
highest hill.
Highest_45 to view the base station on the
highest hill.
-
In the tree, expand
 Site 1 Ant 1 to view the result entries.
-
In the tree, click
 Power to view the power result.
- Right-click on the legend and from the right-click context menu, click .
- In the Max field, enter a value of -30 dBm.
- In the Min field. enter a value of -120 dBm.
Figure 1. Power calculated for the base station located at the highest hill - Site 1 Ant 1 using the DPM. 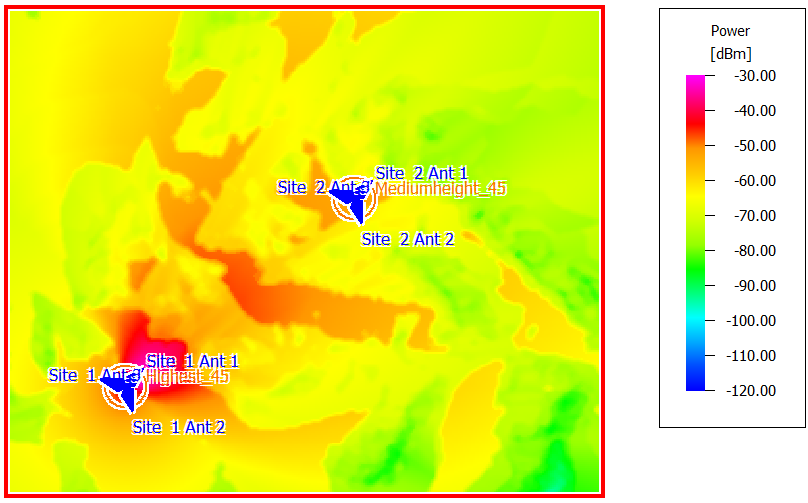
Note that this antenna has broad coverage over a large area, but not towards the city center. It has no line of sight to the city center; a few lower hills are in the way. -
In the tree, expand
-
View the power using the DPM for
the base station located on a lower hill.
-
In the tree, expand
Results: Propagation to view the results for the
two base stations.
-
In the tree, expand
Mediumheight_45 to view the base station on the
lower hill.
-
In the tree, expand
Site 2 Ant 1 to view the result entries.
-
In the tree, click
Power to view the power result.
Figure 2. Power calculated for the base station located on a lower hill - Site 2 Ant 1 using the DPM. 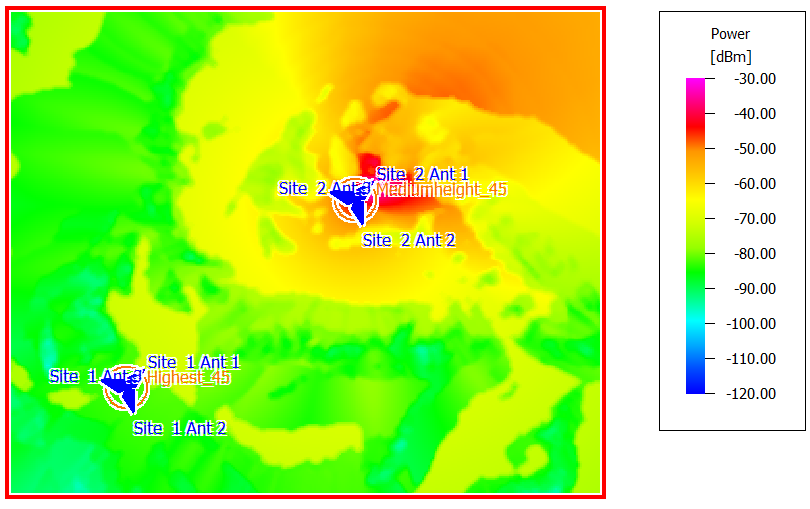
Note that this antenna has great coverage of the city and poor coverage elsewhere. -
In the tree, expand