cdfplot
Create an empirical cumulative distribution function plot.
Syntax
cdfplot(X)
cdfplot(..., fmt)
cdfplot(..., property, value, ...)
h = cdfplot(...)
[h,stats] = cdfplot(...)
Inputs
- X
- A data sample for which to compute the empirical cumulative distribution.
- fmt
- Formatting string of the curve.
- property
- Any valid property for a line graphic object.
- value
- Value of the property.
Outputs
- h
- Handle of the line graphic object.
- stats
- The quantile values on the horizontal axis.
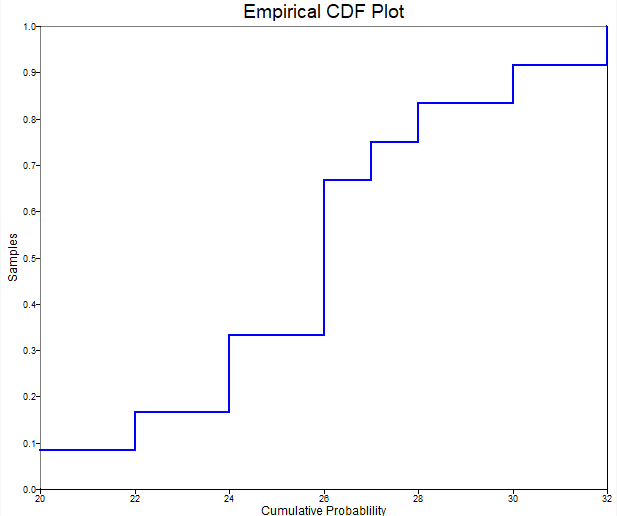
Examples
data = [26, 26, 28, 27, 30, 32, 20, 22, 24, 24, 26, 26];
cdfplot(data);