Thermal Analysis
Using above settings, you can conduct a thermal analysis. From the menu bar, click .
Analysis Result
After running analysis, PollEx Thermal automatically shows results. You can save analysis result and upload it. PollEx Thermal shows each points temperature for X and Y axis.
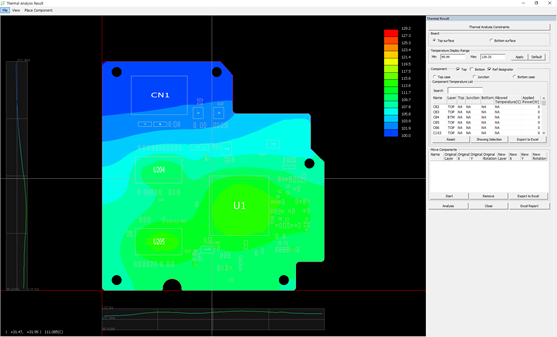
Figure 1.
Analysis Result Dialog
To review, you can use the Analysis Result dialog. You can review detail temperature, edit design, and redo thermal analysis.
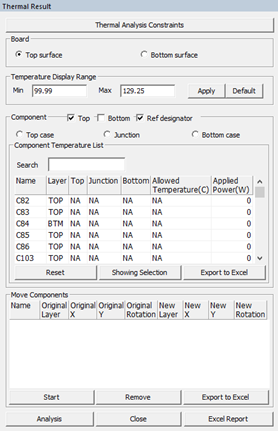
Figure 2.
Thermal Analysis Constraints: Use this menu button to go back to Thermal Constraints Setting dialog. After changing constraints, click Analysis to re-run thermal analysis.
Board: Control the displaying sides for top and bottom surface.
Temperature Display Range: The temperature contour range can be adjusted to the desired range.
Component: Control the component displaying status to top, bottom and reference designator. To check components’ top, bottom and junction temperature, use values in table box. Also check the applied power, which is based on analysis power level (%) defined in Comp Thermal Condition section.
Move Component: At this tab, click Start to change location of components. After selecting component on design, re-locate component in certain location. This feature is effective when their users want to disperse high-temperature components.
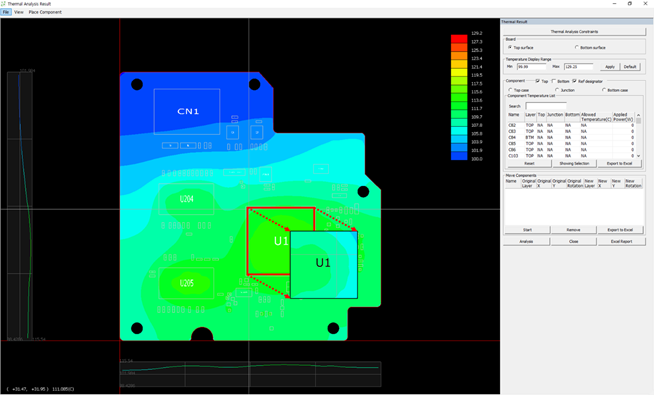
Figure 3.
After component moving, at table menu, PollEx Thermal shows moved components’ list and their moved information.
Analysis: Use this menu to re-run thermal analysis.
Excel Report: Use this menu to have thermal results and conditions exported in EXCEL format.
Save Data
The PollEx Thermal results can be saved in .PTHR format by clicking Save or Save As. Also, detailed results such as temperature for each location of the result can be exported in CSV or EXCEL format.
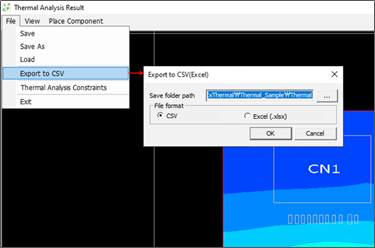
Figure 4.