
Post-Processing
Use the Show Analysis Results tool to view the results of an analysis in the Analysis Explorer. View and animate results, add callouts, and compare results from different runs.
Results must be available before attempting post-processing.
-
From the Polymers ribbon, click
the Analysis tool.

Post-processing mode is activated. - Optional:
If you need a detailed analysis of results, use HyperView, which requires the appropriate license
features. Inspire's post-processing features are
adequate to analyze and understand the results.
Figure 1. 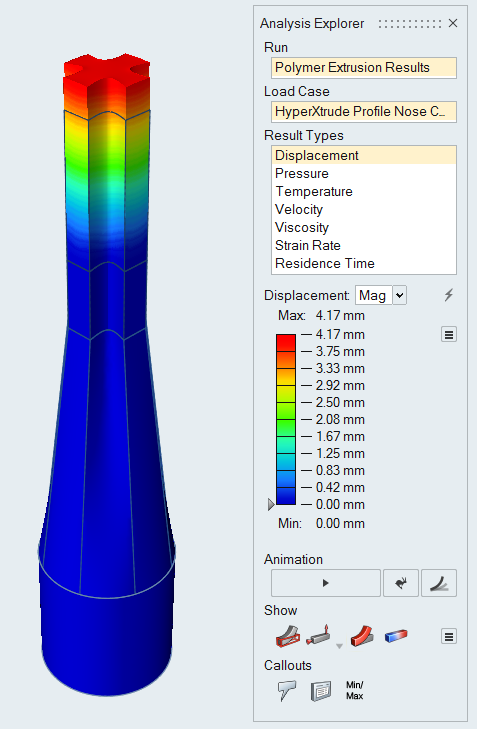
Animate and Record Results
Use the Animation Toolbar that appears at the bottom of the modeling window to animate and record results.
Animate the Results
If you've previously run an analysis, click the Play button on the animation toolbar to animate the results.
-
Click the
 button on the
animation toolbar to review the analysis. Click the
button on the
animation toolbar to review the analysis. Click the  button to pause
the animation.
button to pause
the animation.
- Optional:
Click the
 icon to change the animation settings.
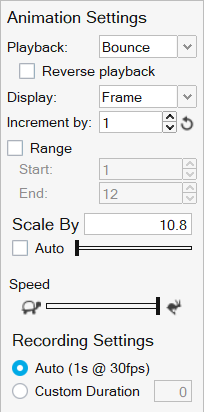
- Right-click and mouse through the check mark to exit, or double-right-click.
Record the Results
Capture to a video in .mp4 format by clicking the ![]() button on the animation toolbar.
button on the animation toolbar.
- If you haven't already done so, play back your results to get an idea of what you're about to record.
- Optional:
If desired, click the icon to change the animation settings.
-
Click the
 button on the animation toolbar to begin recording
the motion results; the icon changes to red to indicate that it is recording.
Click the icon again to stop recording.
button on the animation toolbar to begin recording
the motion results; the icon changes to red to indicate that it is recording.
Click the icon again to stop recording.
- When the recording is finished, the video is automatically saved in the C:\Users\<yourname>\Documents\Altair\videos directory. It is automatically given a name constructed from the time stamp, i.e. recording2018.8.8_15.47.39.mp4.
- Right-click to exit review mode.
- The default behavior is continuous recording, but the recording will stop automatically if the playback option is set to Once rather than Loop.
- To hide the workflow help, select , and in the Workspace category clear the Show workflow help checkbox.
- To avoid recording the mouse cursor, click the
 button on the animation toolbar and press the
Tab key to move the focus to the button. Then press the Spacebar to start or
stop the recording.
button on the animation toolbar and press the
Tab key to move the focus to the button. Then press the Spacebar to start or
stop the recording. - Note that the video recorder captures everything in the region of the modeling window. Avoid obscuring or minimizing that window during the recording process.
Animation Options
The animation options allow you to start and stop the animation and adjust basic settings.
| Option | Description | |
|---|---|---|
| Play/Stop Animation |  |
Animate the selected result. |
| Animation Speed | Change the speed of the animation. | |
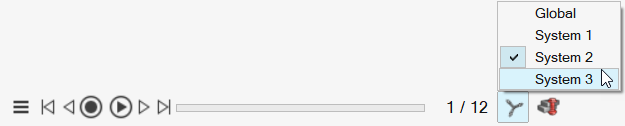
Animation Toolbar
Use the animation toolbar to play, record, and configure the animation.

- Animation Settings
- Click to open the Animation Settings.
- Play and Record/Stop Recording
- Click the button to begin recording the results; the icon changes to red to indicate that it is recording. Click the icon again to stop recording.
- Start Animation/Pause Animation
- Click the button to start or pause the animation. Use the arrow buttons to jump the first or last frame in the animation.
- Move to First/Previous/Next/Last Step
- These buttons allow you to step through the animation frame-by-frame. If you hold down the Previous or Next button, it will auto-repeat. If you want to skip frames, use the Increment By feature in the Animation Settings; hold Ctrl to temporarily override this behavior.
- Slider
- Drag the slider on the toolbar to view a particular point during the analysis; use the arrow keys to move frame-by-frame through the animation.
- Current Step
- Displays the current time or frame. You can also enter a value to go to the nearest time/frame.
Animation Settings
Modify the animation settings from the animation toolbar.
- Playback
- Select whether to play the animation on a continuous Loop, Once, or Bounce (between forwards and backwards). Select the check box to Reverse Playback.
- Display
- Set the units for the slider to either Time or Frame.
- Increment By
- Increase the value in the counter to skip frames during playback. The reset button restores the default value of 1.
- Speed
- Drag the slider to change the speed of the animation.
- Range
- Select the Range checkbox to define and starting and ending frame for the
animation. This allows you to limit the playback range to just a portion of
the animation, making it easier to study behaviors in more detail. You can
use the Ctrl key while clicking on the Start or End icons to jump to Range
Start and Range End, respectively. Note: For motion models, you can fit plots for the selected range by using the Ctrl key while double-clicking. Also, the paths of tracers will be trimmed to honor the specified range.
- Scale Factor
- Enter a custom value to change the scale of the animation. Generally the scale of a displacement is too small to see clearly, so auto scaling is enabled by default.
- Recording Settings
- The default Auto setting gives you an estimate of the duration of the recording at 30 frames per second. If your video plays back faster than you want, select Custom Duration to change the length of the video; this will adjust the frame rate to try to achieve the specified duration. The Custom Duration has a minimum value of 1 second, and maximum value of 30 seconds.
Animation Shortcuts
| To | Do this |
|---|---|
| Play and pause | If the Play button is active, press the Spacebar. |
| Go to the first/last frame | Press the Home or End key. |
| Go to the next/previous frame | Press the Page Up or Page Down key. |
| Increment the slider |
Use the arrow keys to move frame-by-frame through the animation, or position the cursor over the slider and use the scroll wheel. |
| Exit tool | Right-click and mouse through the check mark to exit, or double-right-click. |
Result Types
| Option | Description |
|---|---|
| Displacement | The displacement plot gives a measure how much the profile has deformed. The displacements are computed from the velocities and these show how the profile evolves. In addition, the displacements can be used to see if the profile meets dimensional tolerances. This result is qualitative and helps to determine if the die is well balanced. |
| Temperature | Viscosity of a material is a strong function of temperature and
strain rate. Hence, understanding the temperature distribution is
the key to successful extrusion. Temperature data is used to determine where excessive heating occurs in the die due to stress work. Polymer degradation might happen if the temperature exceeds the absolute maximum melt temperature. This data is provided by the vendor. Temperature distribution in the profile region is used to determine the surface quality and other material characteristics. In the profile region, temperature variations of about 5% or less are acceptable. For high end applications, there are tighter tolerances. |
| Velocity | This data provides a detailed understanding of how polymer melt flows during extrusion. Using this data, we can detect flow imbalances at the die exit. In the case of multi-hole dies, we can determine how fast the profile is exiting from each hole and the resulting profile length during each cycle. Studying the material flow in the die regions helps redesign to improve its performance. |
| Pressure | The pressure at the inlet provides the force required to extrude the polymer. This can help correlate with pressure achieved by pressurization devices such as a single screw extruder. This data also provides information on the resulting extrusion loads on the die surfaces that come in contact with the polymer. This data is used to predict tool deflection. |
| Viscosity |
The viscosity plot shows resin viscosity in different regions of the die. Since viscosity depends on shear rate and temperature, viscosity is lower in regions where strain rate and temperature are high (e.g., near the die wall). Viscosity, on the other hand, is high in regions with low shear rate and temperature (e.g., at the central region of flow). Identifying these helps modify the die geometry to obtain better flow control. |
| Strain Rate | Strain Rate shows how fast the deformation (strain) change occurs
at a given point. The effective strain rate provides information on
regions where a material undergoes excessive shear. Polymer viscosity is a strong function of effective strain rate. Polymers used for extrusion are often shear-thinning thermoplastics, and they have lower viscosity at higher shear rates. The polymer chain elongates more at a lower shear rate than at a higher shear rate (as the polymeric chain starts breaking at a higher shear rate). Higher ultimate elongation values are associated with increased toughness. A higher strain rate increases polymer yield stress and tensile modulus. Hence, there is a trade-off between load-bearing properties and impact resistance. |
| Residence Time |
Residence Time provides information on how much time each particle of polymer melt spends inside the die cavity before exiting the die. The solver computes the residence time by solving a scalar transport equation using the computed velocities. Note: When dead elements are present in
the flow domain (i.e., all four nodes of TET4 elements touch
the die wall), this value can become very high. These are
hot spots; you can ignore such regions since they are
artifacts of automatic meshing. This can be avoided by a
manual CFD layered meshing near the walls.
|
| Relative Exit Speed Difference | This data directly correlates to whether the extrusion is balanced or not. The values are a relative percentage difference of local speed compared to average extrusion speed. Hence, a value close to zero means the extrusion die is balanced, and higher percentage values mean there are greater imbalances in die. |