Viewing the Results
View and post-process the results in POSTFEKO.
-
Compare the near field along the Z axis between the exact
and the computed near field.
Figure 1. Near field along the Z axis. 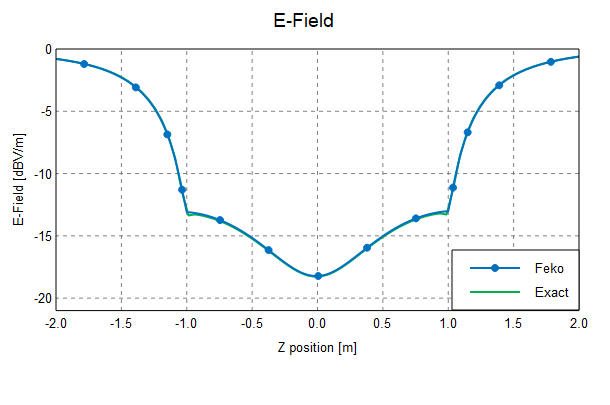
-
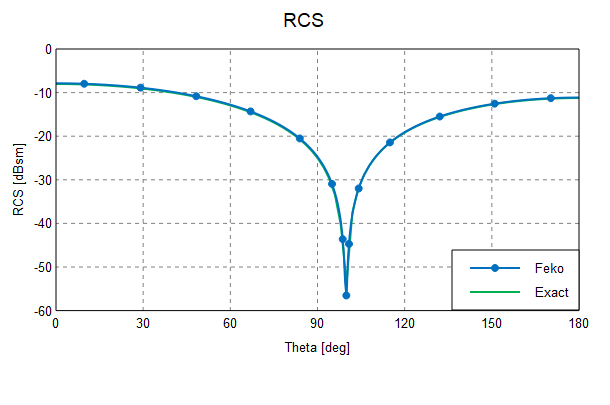
Compare the RCS results on a far field graph.
- Change the Y axis to a logarithmic scale for improved visualisation.
Figure 2. Bistatic radar cross section of the dielectric sphere.