


|
Working with Data Table Editor
Most of the sections in this editor are available in Workbook Internal Data Table Editor. However, you can only create a single data table in this editor. To join data tables, you can use the Joined Data Table Editor.
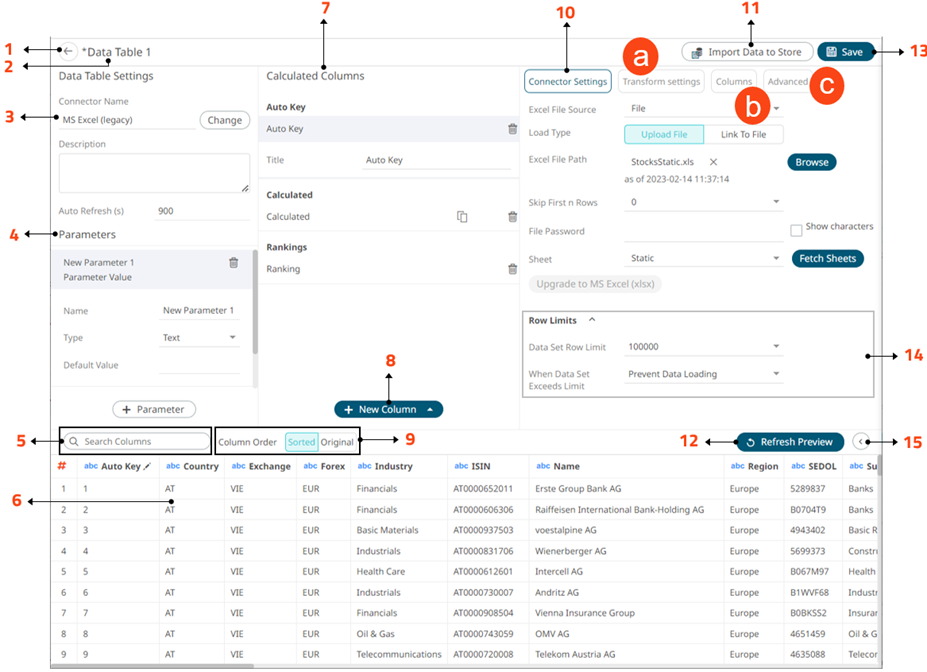
Data Table Editor Sections and Definitions
|
Section |
Description |
|
1 |
Back Exit the Data Table Editor and go to the Data Library page. |
|
2 |
Data Table Name Name of the data table. To modify, use the Rename option in the context menu. |
|
3 |
Data Table Settings Displays the data source that you will connect to. Click to select another data source. Other data table definitions are displayed including the description and the auto refresh period (in seconds). |
|
4 |
Data Table Parameters Add or manage data table parameters. |
|
5 |
Search Columns Allows searching of columns on the Data Preview. |
|
6 |
Data Preview Executes the queries to return and display preview of the data table you are creating. NOTE: The maximum number of rows displayed in the Data Preview is 100. |
|
7 |
Calculated Columns Allows you to view and manage the calculated columns. |
|
8 |
New Column Options Allows you to add any of the following columns: · Auto Key · Ranking · Identity, Sign, Manual, Equal Density, and Equal Distance numeric buckets |
|
9 |
When the Column Order is set to Sorted, the columns are grouped by type (Text, Date/Time, then Numeric) and sorted alphabetically. |
|
10 |
Connector Settings Displays the connector settings of the data source and allows for limiting the amount of data to be returned. |
|
11 |
Import to Data Store Allows you to import the data table to a data store. |
|
12 |
Refresh Preview Allows you to refresh the data preview. |
|
13 |
Save Data Table Saves the data table definition. |
|
14 |
Row Limits Settings Allows setting of the row limit of data sources. |
|
15 |
Collapse Data Preview Collapse the Data Preview pane. Click to expand the Data Preview pane. |
Clicking Transform
Settings  displays
the Transform Settings pane.
displays
the Transform Settings pane.
![]()
|
Section |
Description |
|
Transform Settings |
Allows you to: · Pivot or unpivot retrieved data. · Transform data to enable time series analysis including interpolation. · Run an R or Python script for data transformation. · Lists of orders to be reconstructed into an Order Book and conflated for output display. |
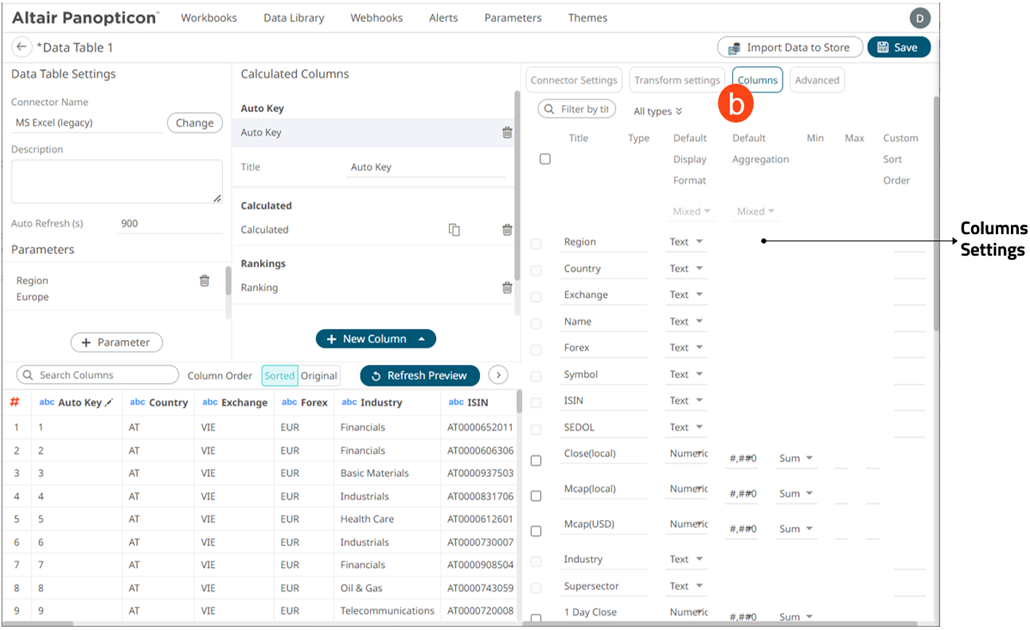
Clicking Columns
 displays the Columns Settings
pane.
displays the Columns Settings
pane.
|
Section |
Description |
|
Columns Settings |
Allows you to: · View the column data type · Rename the column names · Select the numeric or Date/Time format · Select the numeric default aggregation · Define the Min and Max range of numeric columns · Define custom sort order |
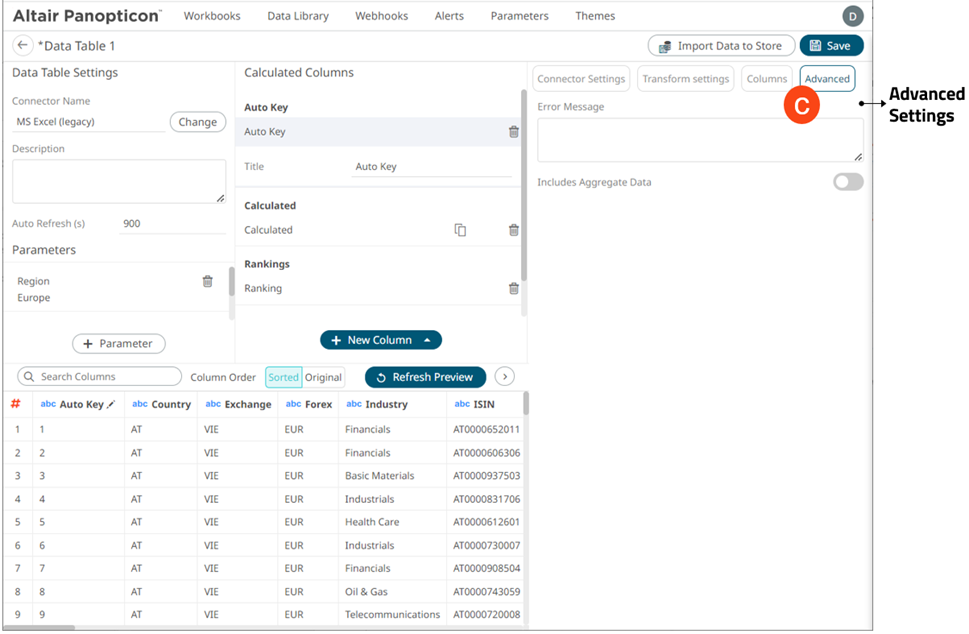
Clicking Advanced
 displays the Advanced Settings
pane.
displays the Advanced Settings
pane.
|
Section |
Description |
|
Advanced |
Allows you to: · Enter custom Error Message that will be displayed when an error occurs while fetching data. Can be parameterized. · Retrieve external aggregates |