Setting the Min and Max Range for Numeric Columns
Setting the Min and Max values, for the Fixed Range of X and Y variables in visualizations, can be done on the Columns pane of the Data Table Editor layout.
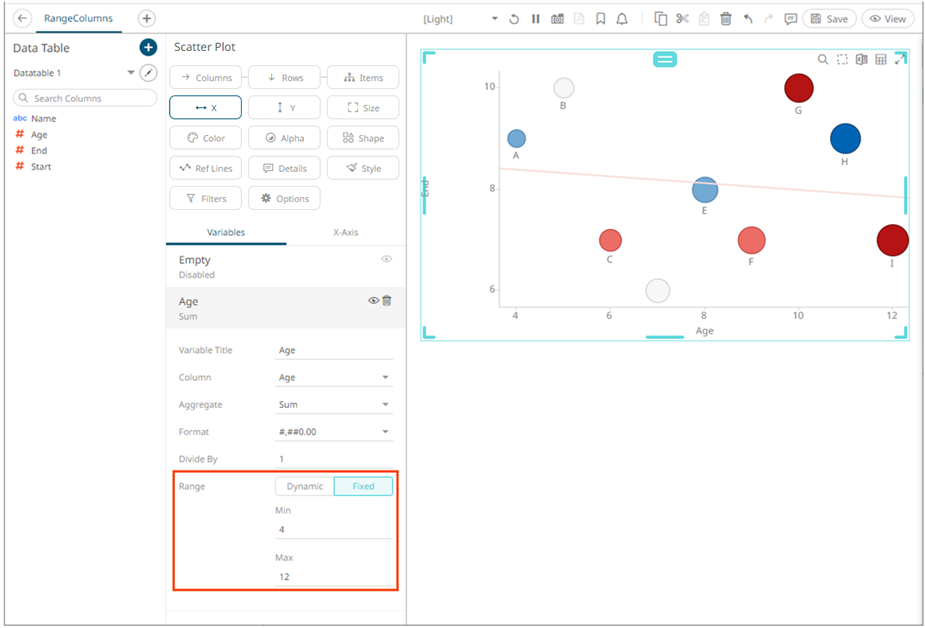
For example, these numeric columns or fields have the following fixed Min and Max ranges:
|
Column |
Min |
Max |
|
Age |
4 |
12 |
|
Start |
1 |
5 |
|
End |
6 |
10 |
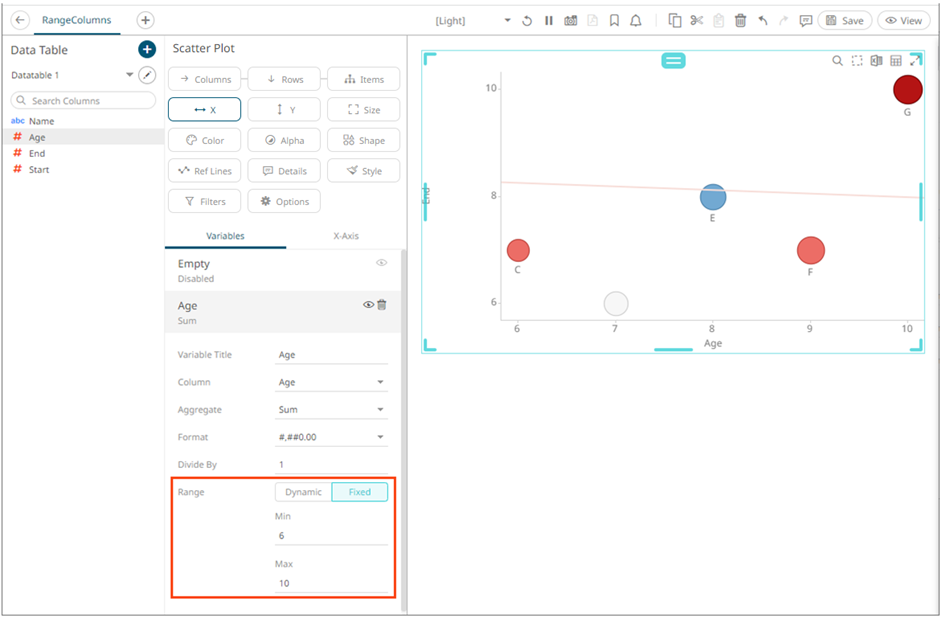
On the visualization, when the Age column is dragged to the X variable, the Min and Max values are applied.
Follow the steps below to modify the Min and Max fixed range.
Steps:
1. On the Data Sources panel, click a data source to display its settings.
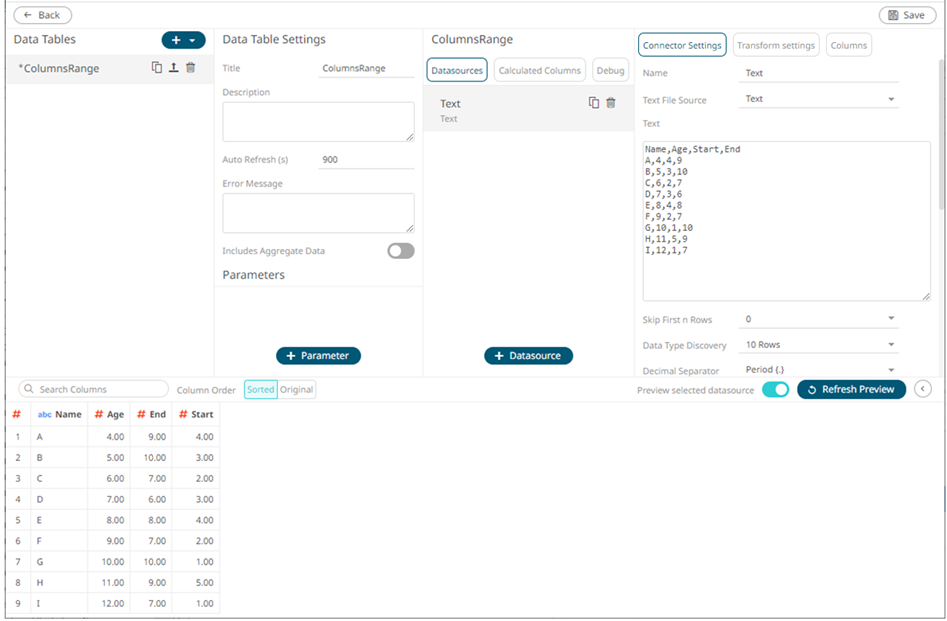
2. Click Columns. The Columns pane displays with the list of available columns in the data source.
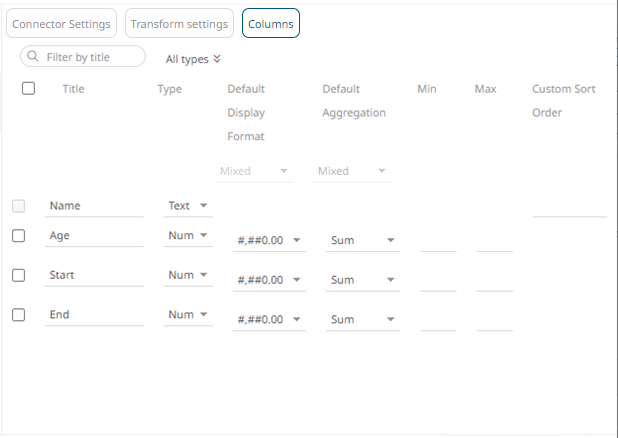
3. To set the fixed range for a single numeric column, enter the Min and Max values.
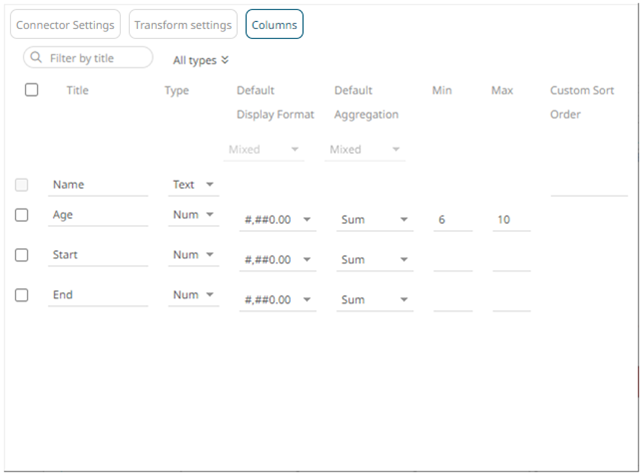
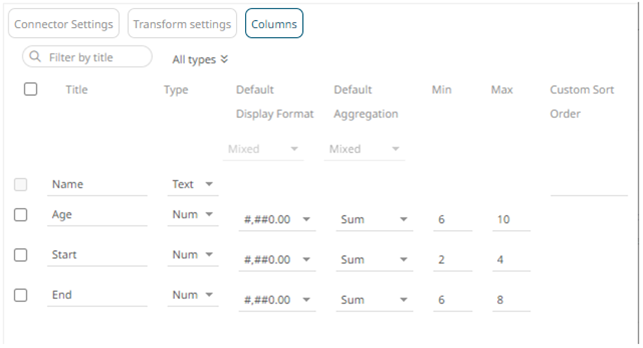
To set the fixed range for several numeric columns, check their corresponding boxes and enter their Min and Max values.
For example:
|
Column |
Min |
Max |
|
Age |
6 |
10 |
|
Start |
2 |
4 |
|
End |
6 |
8 |
4. Click the Save  button.
When
saved, the notification displays.
On the visualization, when the Age column is dragged to the X variable, the set Min and Max values are applied.
