Results
All results have ASCII text format and are computed for the specified prediction area.. Due to the open ASCII format, you can draw graphs with third-party tools and do further evaluations and post-processing.
MIMO channel matrices are computed per point and per ray. If antenna correlation is considered additionally, the matrices will include the effect of the antenna correlation.
The antenna correlation coefficients can be written optionally to an ASCII file either for the antenna spacing defined on the Tx array and Rx array page, or for a specified range of antenna distances. For the second case a matrix or a tabular output format can be chosen.
The matrix format of the antenna correlation coefficients has the following design:
In the tabular format, the correlation coefficients are listed with increasing distances between the elements one after the other.
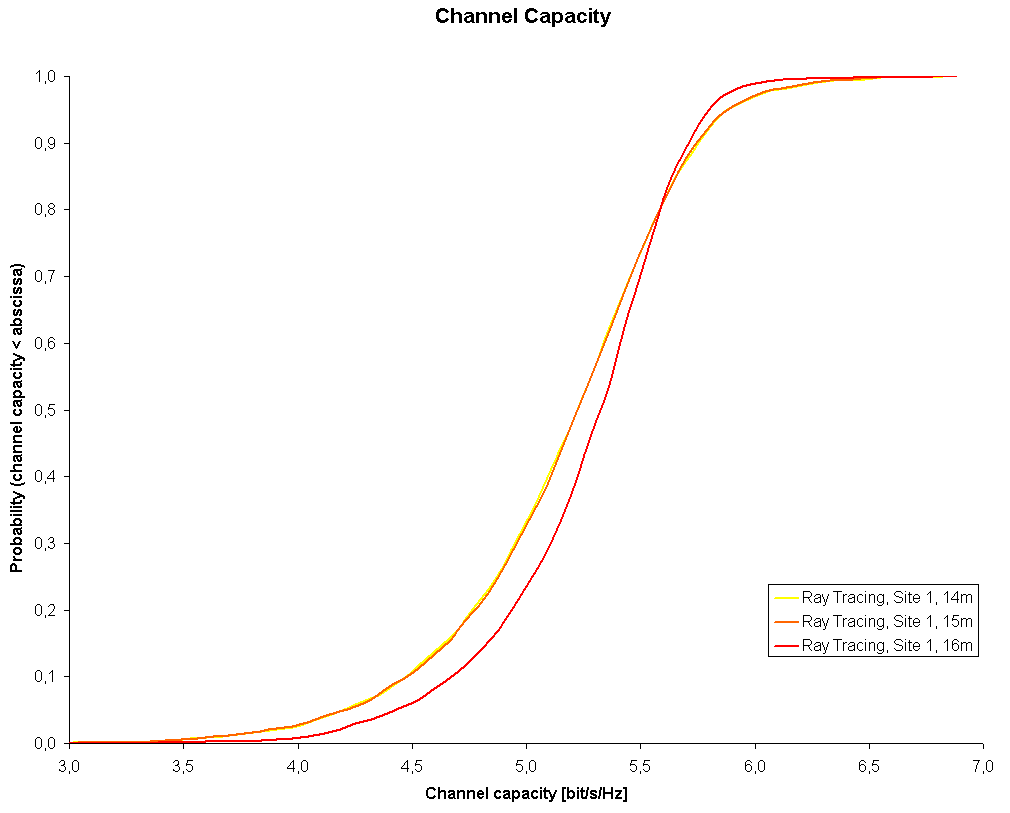
The section about the channel capacity offers a general output with the capacity value of the MIMO channel at each pixel of the investigation area. Besides this, the probability density function and the cumulated probability density function of the channel capacity (whole evaluation area) can be written to an ASCII file. These values can be easily plotted with another software tool.