This tool is supported for both structural static and dynamic analysis.
Important: To access this tool, an analysis must be solved first.
Structural Static Analysis
在Project Tree中,点击机构分析分支,打开分析工作台。
在 Analysis Workbench 中,选择 紧固件合力 > 螺栓/螺母合力。
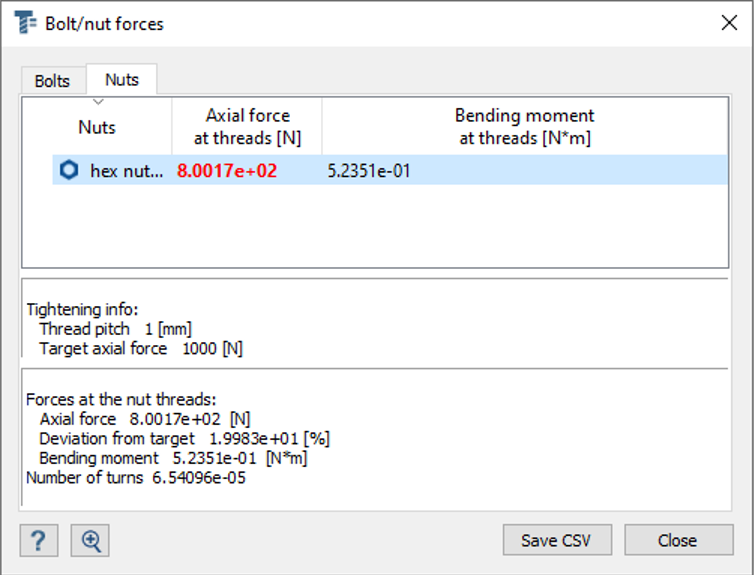
The Bolt/nut forces dialog will open and display a
table of resultant forces for tightened or not tightened bolts and
nuts.
Go to the desired tab to display either Bolts or
Nuts.
Note: If there are no bolts and/or nuts in the model, the respective tab(s) will
not be available.
Select any column header to sort the table by that header.
Tip: Number of nut turns is also listed in the
forces summary for bolts tightened via torque and axial force.
Select any row to display a forces summary.
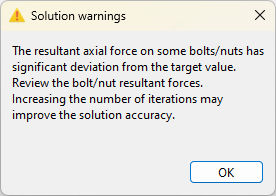
Note: When the resultant axial force of the bolt/nut deviates by over 10%, the
following occurs:
In the Project Tree, a warning icon appears
next to the Results branch. Right-click on
Results and select
Warnings from the context menu.Figure 1.
In the Bolt/Nut forces dialog, nuts with
significant deviation are marked in red and deviation from the
target is listed.Figure 2.
Dynamic Analysis
Bolt/nut resultant forces can also be
plotted for dynamic analysis, including transient, frequency, and random response
analysis.
在Project Tree中,点击多载荷工况分析分支,打开分析工作台。
在 Analysis Workbench 中,选择 紧固件合力。
The Bolt/nut forces dialog will open and display a
table of resultant forces for tightened or not tightened bolts and
nuts.
Go to the desired tab to display either Bolts or
Nuts.
Note: If there are no bolts and/or nuts in the model, the respective tab(s) will
not be available.
Select a Force/Moment type from the Response
dropdown.
Optional: If plotting multiple forces, select the Show each plot in separate
window checkbox to create multiple plots.
Click Evaluate.
A new dialog will open showing a graph of the chosen force. Use the
radio buttons in this dialog to change the axis scale.
To plot the partial response, do the following.
From the plot dialog, pick a point on the curve to show the Modes
contributions into response table.
In the table, select rows to choose which modes to include in the
partial response.
Click Evaluate response.
The plot in the dialog will update to show the partial
response.
Note: In the Fastener resultant forces dialog for a random
response solution, choose between PSD and
RMS as the response type. This selection impacts the
values displayed in the table. However, when the forces are plotted, the curve will,
by default, show both the RMS and PSD curves for the selected forces in a single
plot.
 紧固件合力 > 螺栓/螺母合力。
The Bolt/nut forces dialog will open and display a table of resultant forces for tightened or not tightened bolts and nuts.
紧固件合力 > 螺栓/螺母合力。
The Bolt/nut forces dialog will open and display a table of resultant forces for tightened or not tightened bolts and nuts. appears
next to the Results branch. Right-click on
Results and select
Warnings from the context menu.
appears
next to the Results branch. Right-click on
Results and select
Warnings from the context menu.