
View Structures Analysis Results
Use the Show Analysis Results tool to view the results of a linear static, normal modes, or buckling modes analysis in the Analysis Explorer. View and animate results, add callouts, and compare results from different runs.
Show Results in the Analysis Explorer
Use the Analysis Explorer to view the results of an analysis.
-
Click the Show Analysis Results tool on the
Analyze icon to open the Analysis Explorer.

Tip: To find and open a tool, press Ctrl+F. For more information, see Find and Search for Tools.
- Select the Run you want to view.
- Select a Load Case.
- Select a Result Type. The result is displayed in the modeling window.
- Use the additional options to animate the result, change what is shown in the modeling view, create callouts, and compare results.
- Right-click or press Esc to close the Analysis Explorer and return to the original part.
Analysis Explorer Options
The Analysis Explorer includes options that allow you to select a run, display a result type, add callouts, and adjust how the results are shown.
Run
To delete a run from the Analysis Explorer, right-click the run name to select Delete Run.
Load Case
The Result Envelope is created when you have two or more static load cases. It shows the maximum value for each result type across all load cases.
Result Types
Modes
All physical objects have frequencies at which they vibrate that are called normal modes. If you chose to run a normal modes analysis in the Run Analysis window, the modes will be listed here when you select Normal Modes for the Load Case. Click on a mode to view the displacement for that mode.
Bucking Load Factors
Results Slider
- To change the upper or lower bound for the results slider, click on the
bound and enter a new value. Click the reset
 button to restore the default values.
 - To filter the results so that areas on the model with results greater than a
specified value are masked, click and drag the arrow on the results slider.
To mask areas with results less than the specified value, click
 and select Flip Mask.
Select the arrow to enter a specific value.
and select Flip Mask.
Select the arrow to enter a specific value. - To change the legend color for the result type, click the icon next to the results slider and select
Legend Colors.
- To apply the min/max values for the current result type to all load cases,
click the icon next to the results
slider and select Apply current min/max to all load
cases.
- To reset the min/max values for the current result types for all load cases,
click the icon next to the results
slider and select Reset min/max of all load
cases
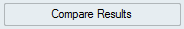
Compare Results
Click the Compare Results button at the bottom of the Analysis Explorer to view a table that allows you to compare analysis runs.
Results are compared in a table format. Additional columns can be added to show additional result types and parameters from the Run Analysis window. The red-blue color bands correspond to the legend in the Analysis Explorer; the width of the band indicates the magnitude of the result. Changes to the upper and lower bound in the Analysis Explorer are automatically reflected in the Compare Analysis Results table.
- Select a row to display the results for that run and load case.
- Double-click a cell in the table to show that result in the modeling window
- Click the chevron next to the table title to select a different result type or a callout.
- Click the chevron on a column header to filter results.
- Click a column header to sort the column
- Right-click a column header to change what result types, run parameters, or callouts are shown in the table.
- Click the top left corner of the table to copy the contents of all cells. This can then be pasted into Excel.
Show/Hide Elements
When the Analysis Explorer is active, an additional Show/Hide Elementsicon appears under the view controls in the lower left corner of the modeling window
Show Options
Determine what is made visible in the modeling window when viewing analysis results. You can show or hide the initial shape, loads and supports, deformation, and/or contours.
| Option | Description | Note | |
|---|---|---|---|
| Show/Hide Initial Shape | Show/hide the initial shape as a reference. | ||
| Show/Hide All Loads and Supports | Show/hide loads and supports. You can also show only the current loads and supports. | ||
| Show/Hide Deformed State | Show/hide the deformed shape as a reference. | ||
| Show/Hide Contours | Show/hide contours. | ||
| Options |
|
||
| Show/Hide Elements | Show/hide the element edges. | This icon appears under the view controls in the lower left of the modeling window, but only when the Analysis Explorer is active. | |
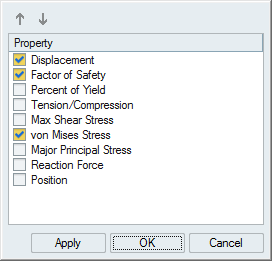
Callout Options
Add visual callouts to show points of interest on your analysis results.
| Option | Description | Note |
|---|---|---|
| Create, Show, and Hide Callouts |
Select to create callouts; select to show and hide callouts. |
|
| List Callouts |
Display in a table all of the callouts that have been created, with
the result types and values. Each callout is specific to the selected
run and load case.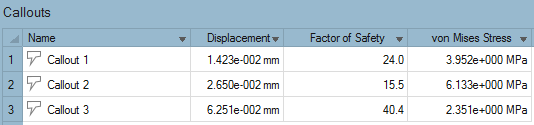 |
|
| Min/Max Callouts |
Create a callout showing where the minimum/maximum value occurs for
the selected result type. Note: When factor of safety is selected, the
minimum value is shown. |
|
| Plot | Display time history plots for callouts defined for structural
analysis. Changes made to the Result Types option are synchronized with
the setting on the Analysis Explorer. Using this option allows you to
put multiple plots of mixed types on a single page. Note: To show a callout plot during a motion
analysis playback, right-click the plot, then select Show
during analysis. |
This option is only available for motion part analysis results. |
| Dynamic Callouts |
Display the results of various result types in existing callouts.
Note: If you enable the Compare Results feature in a callout, the
callout becomes static. |
After creating a callout for a particular result type, click the
|
Compare Results
Compare the results of multiple analysis runs in a table. The Compare Results button is located at the bottom of the Analysis Explorer.
For analysis, you can compare results across all runs and load cases for the selected result type. You can also compare result types at a point of interest where you have placed a callout.
-
Select the Show Analysis
Results tool on the Analyze icon, if
not already active.
Tip: To find and open a tool, press Ctrl+F. For more information, see Find and Search for Tools.
-
Click the Compare Results button located at the bottom
of the Analysis Explorer.
The table for comparing results appears at the bottom of the modeling window. -
Select the row to display the results for that run and load case.
- Double-click a cell in the table to show that result in the modeling window.
- Click the chevron next to the table title to select a different result type or a callout.
- Click the chevron on a column header to filter results.
- Click a column header to sort the column.
- Right-click a column header to change what result types, run parameters, or callouts are shown in the table.
- Click the top left corner of the table to copy the contents of all cells. This can then be pasted into Excel.
Additional columns can be added to show additional result types and parameters from the Run Analysis window. The red-blue color bands correspond to the legend in the Analysis Explorer; the width of the band indicates the magnitude of the result. Changes to the upper and lower bound in the Analysis Explorer are automatically reflected in the Compare Analysis Results table.