Demonstrate a Transfer Path Analysis (TPA) on a simplified vehicle model using OptiStruct. TPA is used to calculate and rank the noise or vibration
contributions for a given Response Point, through the different structural transmission paths in
a system.
Figure 1. Simplified Vehicle Model Figure 2. Connections from Engine Block to Body Representing the Structural
Transmission Paths
Model Files
Before you begin, copy the file(s) used in this example to
your working directory.
The model used is a simplified car model with an acoustic cavity. The model is already
setup for a modal frequency response run. The response point is the node which approximates
the location of the Driver Ear in the acoustic cavity. The source of excitation is a unit
load in the Global Z direction at the Engine Block. The Engine Block is connected to the
Body at 3 points using Engine Mounts modeled as
RBE2+CBUSH. To setup TPA, use the
PFPATH Bulk Data card and reference it using the
PFPATH I/O Option card.
FE Model
Element Types
CHEXA
CPENTA
CTETRA
CQUAD4
CTRIA3
CBUSH
CBAR
RBE2
The linear material properties are:
MAT1
For Steel
For Glass
For Seats
MAT10
For Acoustic Cavity
Results
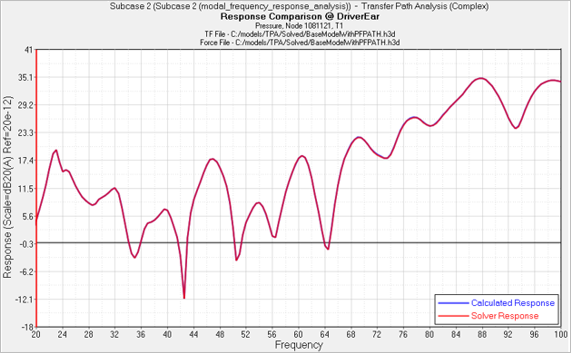
The TPA utility in HyperView is used to post-process the
results. Using the utility, the Calculated Response given by Equation 1 is plotted against the Solver Response
for the Drive Ear Location. The Calculated Response should match up with Solver Response if
all the paths have been considered and the co-ordinate system used for Attachment Forces
output aligns with the co-ordinate system used for Transfer Function output.
Where,
Total pressure
Transfer function, pressure at driver ear for a unit load for path
Attachment force for path
Figure 3. Solver Response versus Calculated Response . (summation of all the paths)
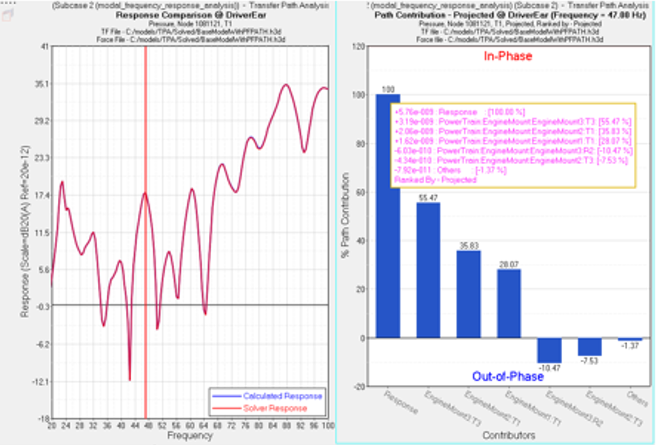
Now select the problem frequency, that is, peak in the response, which may be over the
target level and find the top contributors to the response at that particular frequency.
Figure 4. Top Contributors at a Particular Frequency in Bar Plot
Format