Visualize Crack Growth Plots
Use the Results Explorer to view plots for various result types.
-
From the Evaluate group, click the Evaluate tool.
Figure 1.  The Crack Growth Results Explorer is displayed.
Figure 2. 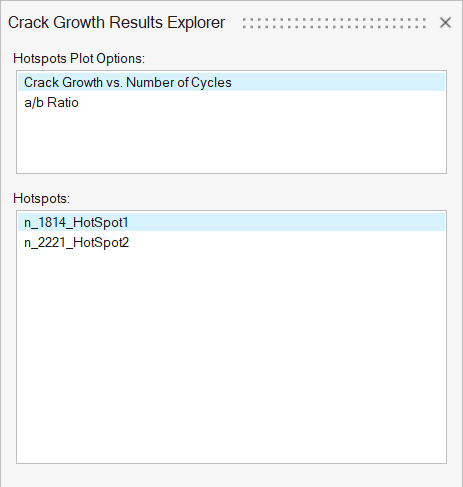
-
Choose between the Hotspot Plot options.
- Crack Growth vs. Number of Cycles
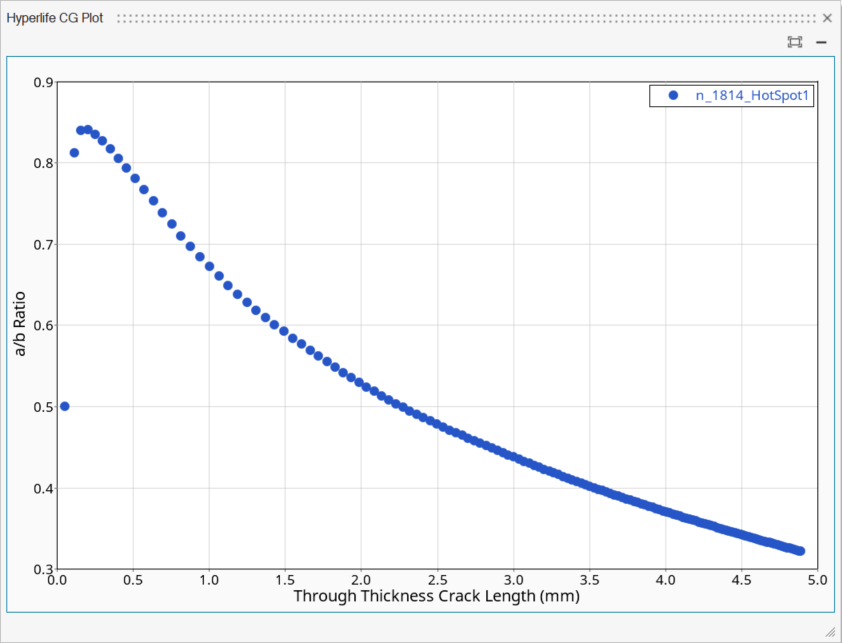
- a/b Ratio
-
Select the desired hotspot.
The plot is displayed.
Figure 3. Crack Growth vs. Number of Cycles Plot 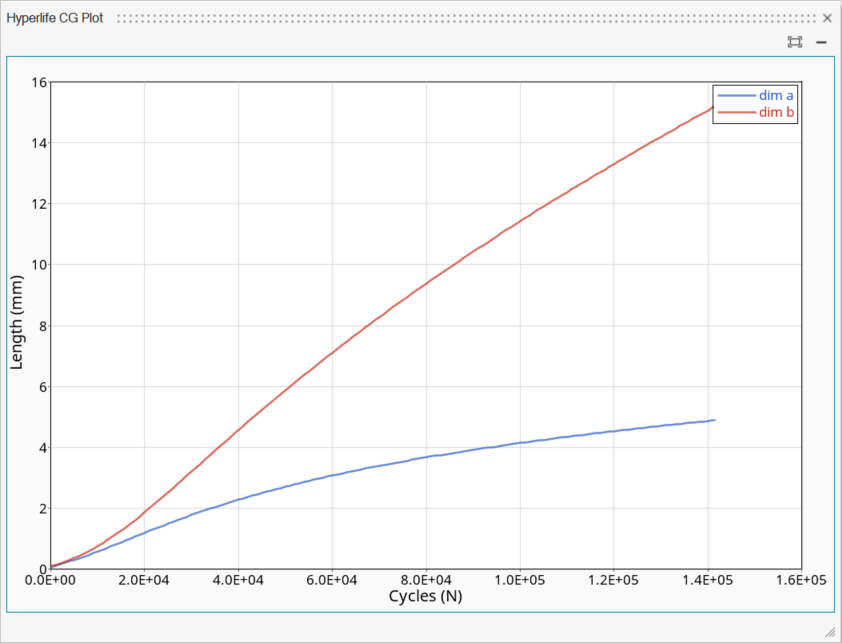
Figure 4. a/b Ratio Plot