Results Table and Chart
Flow Simulator provides convenience to the users through Results Table and Create Plot options. Users can list the results of their model analysis in the Results Table window and generate plots of the results.
How to List Results on the Results Table Window
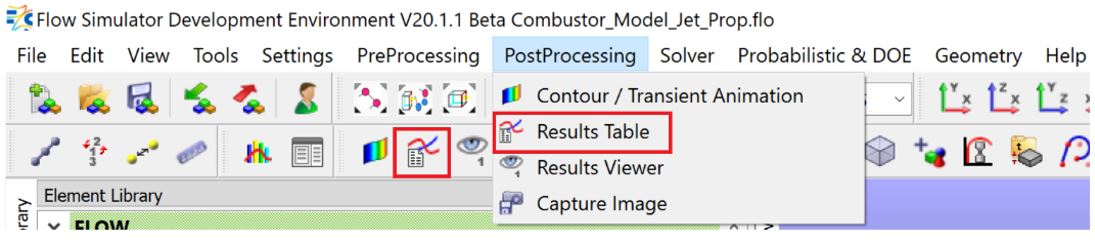
Results Table feature enables users to list the results of all objects’ properties after simulations. Users can open Results Table window through PostProcessing tab or directly from icon, as shown in the below figure.
![]()
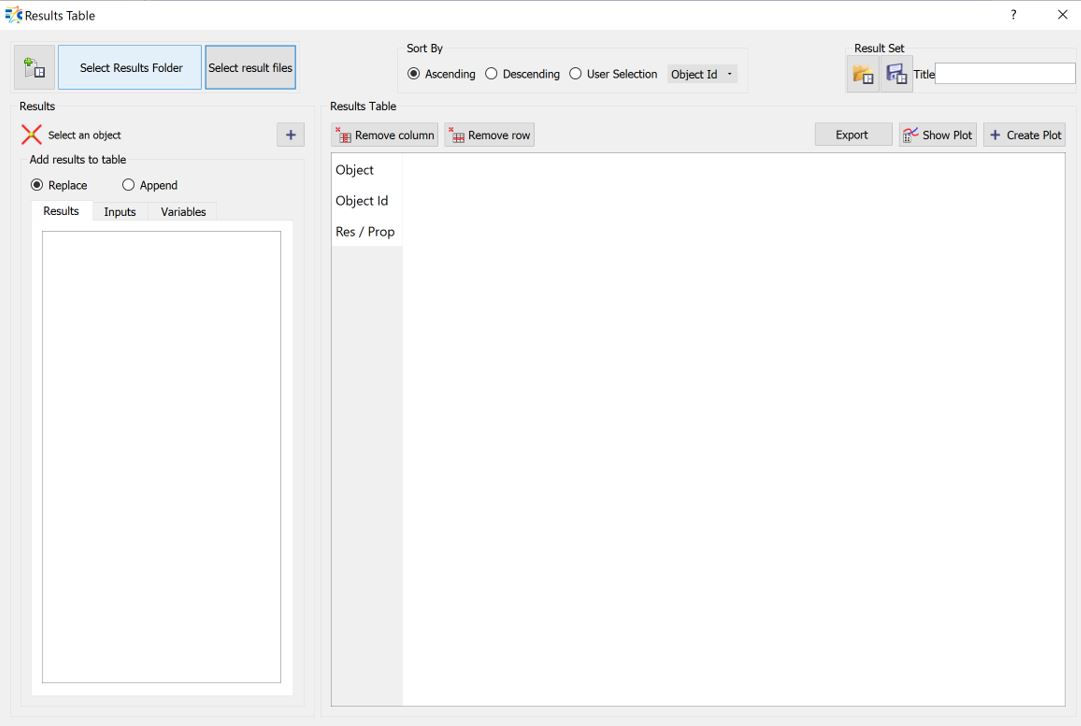
Once the Results Table window is opened, users should follow the following steps;
- Select results folder through “Select Results Folder”
- Decide how to list the objects in the table through “Sort By”
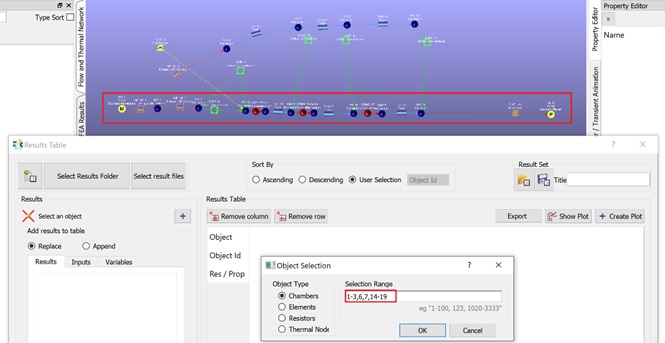
- Select objects
- Add results to the table
- Show More: Most important and mostly used 8 properties are listed in the table
as a first available selection, and the rest of the Properties can be found
under Show More option.
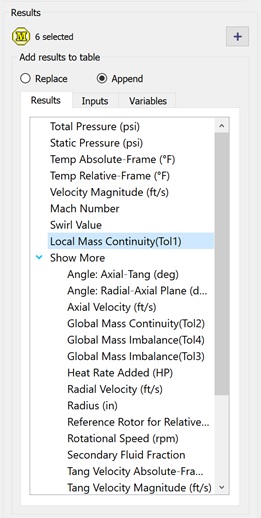
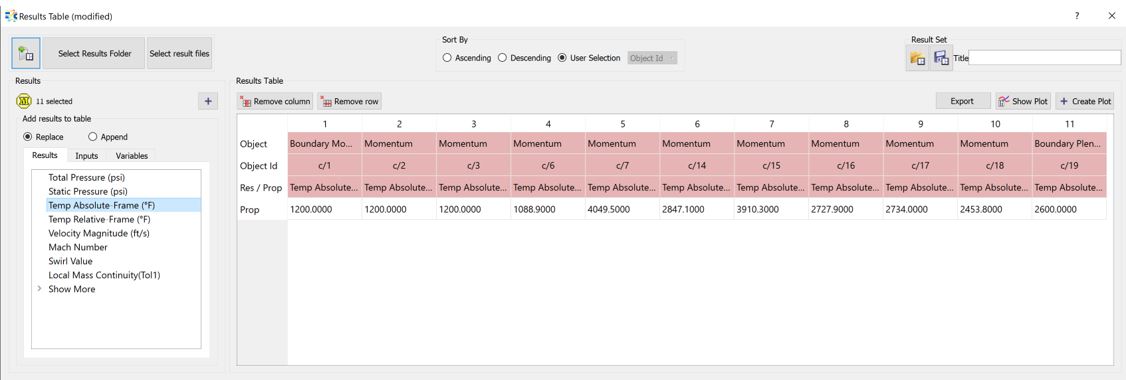
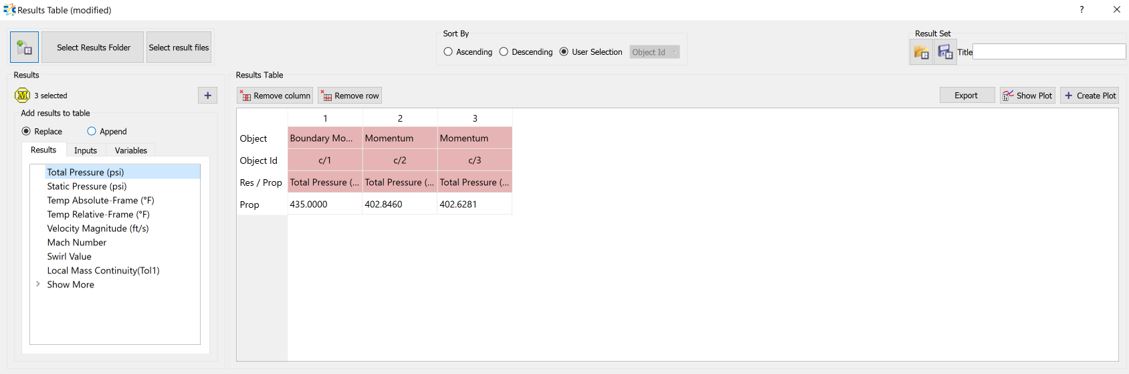
- Replace: Selected results listed on the window each time
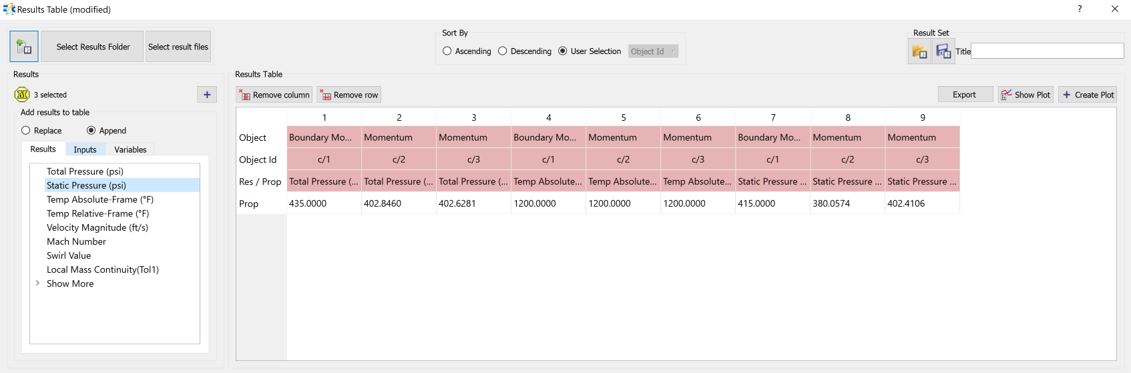
- Append: Selected results added at the end of the list
- Remove Column: If the results of a property wanted to be removed, users can select that column and delete.
- Remove Row: If the results of any case of a multicase run, or results of any time step of transient run are necessary to be deleted, users can select that row and delete.
- Export: this command exports either selected columns or the entire table to a csv file that can be opened in Excel for further usage.
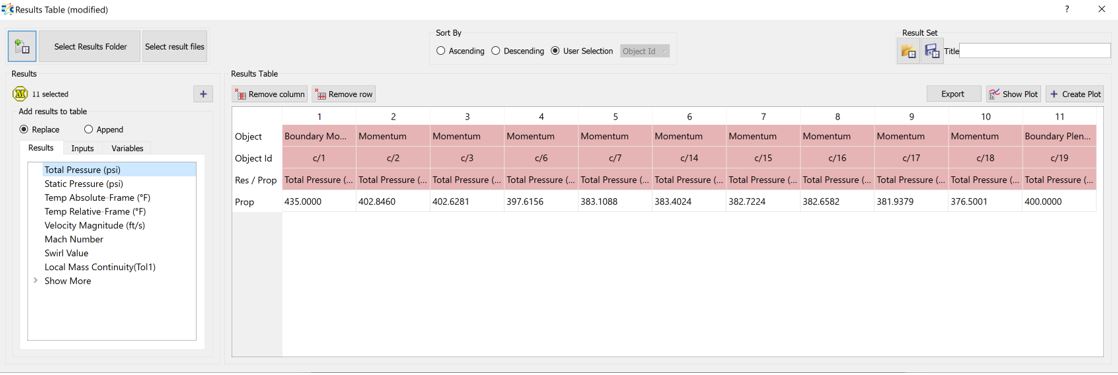
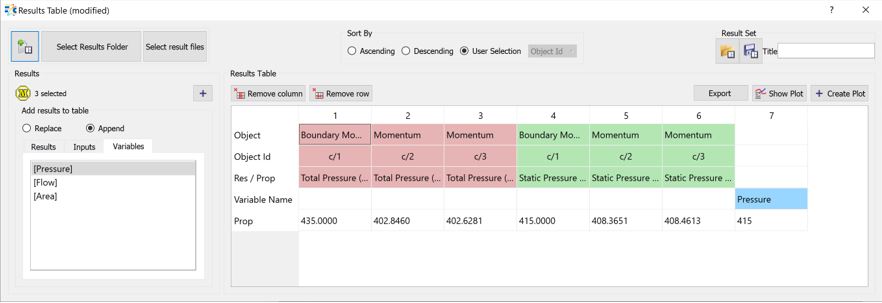
On the Results Table:
| Object | Information of listed Object Type |
| Object Id | Information of Object Type / Object ID |
| Res / Prop | Results of which property is listed |
| Variable Name | Name of the variable that uses Result Variable in its expression set |
|
Note 1: the table shows the above list in orange color if Results are selected Note 2: the table shows the above list in green color if Inputs are selected Note 3: the table shows the above list in blue color if Variables are selected
|
|
| Prop | Values of results or inputs of the selected property |
| Case # | Cases are listed if it is a multi-case simulation result |
| Time | Time steps are listed if it is a Transient analysis result |
Steady State Plots
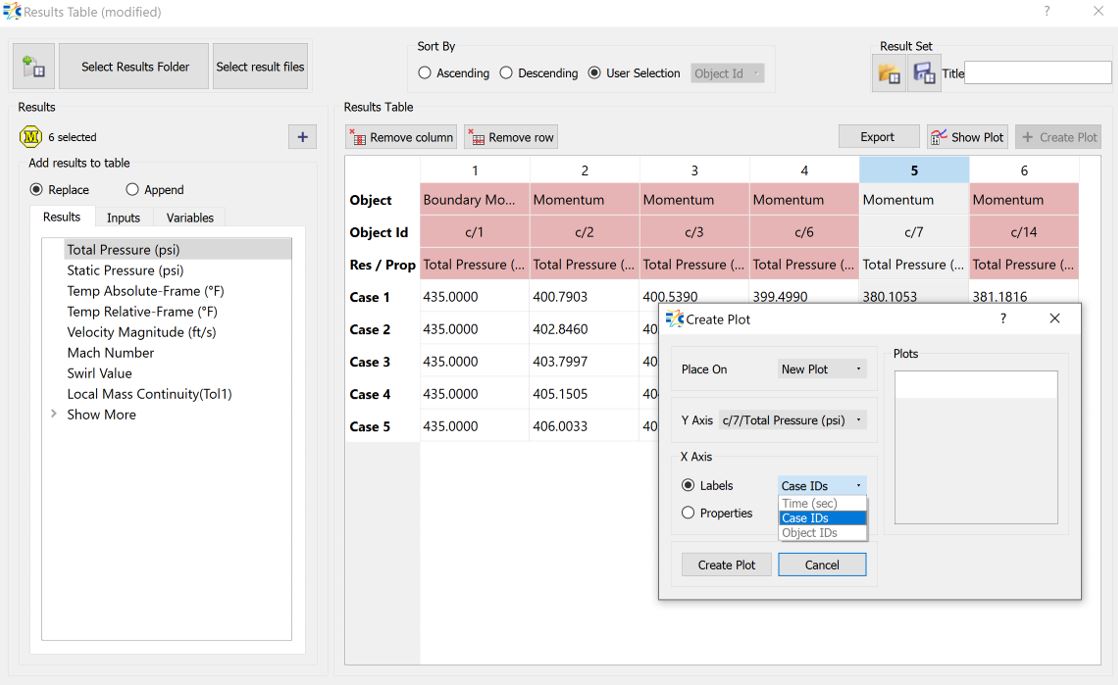
After a steady state analysis, users can plot the results of selected objects. After listing desired Results/Properties in the Results Table, users should select the Prop row and either through Create Plot or by right clicking and selecting Create Plot, the plot window will be opened.
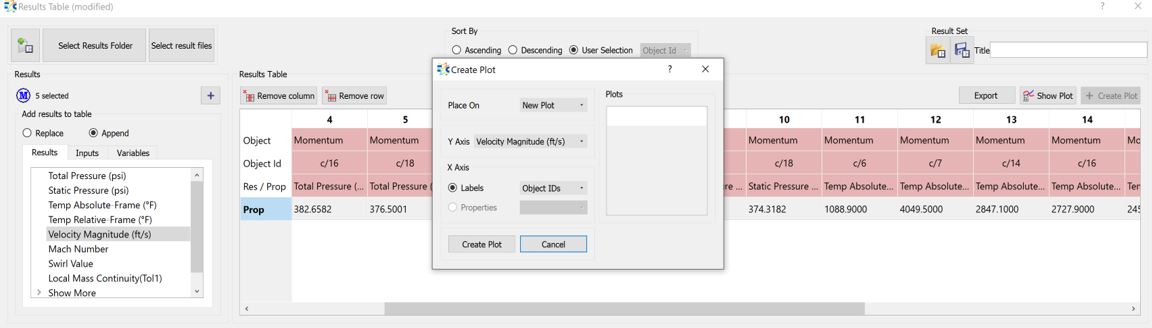
On the Create Plot Window:
In the below example, first Total Pressure selected and plotted on a New Plot. The plot name Plot_1 is listed in the Plots window. Then, Plot_1 has selected, and Static Pressure plotted on Existing Plot_1.
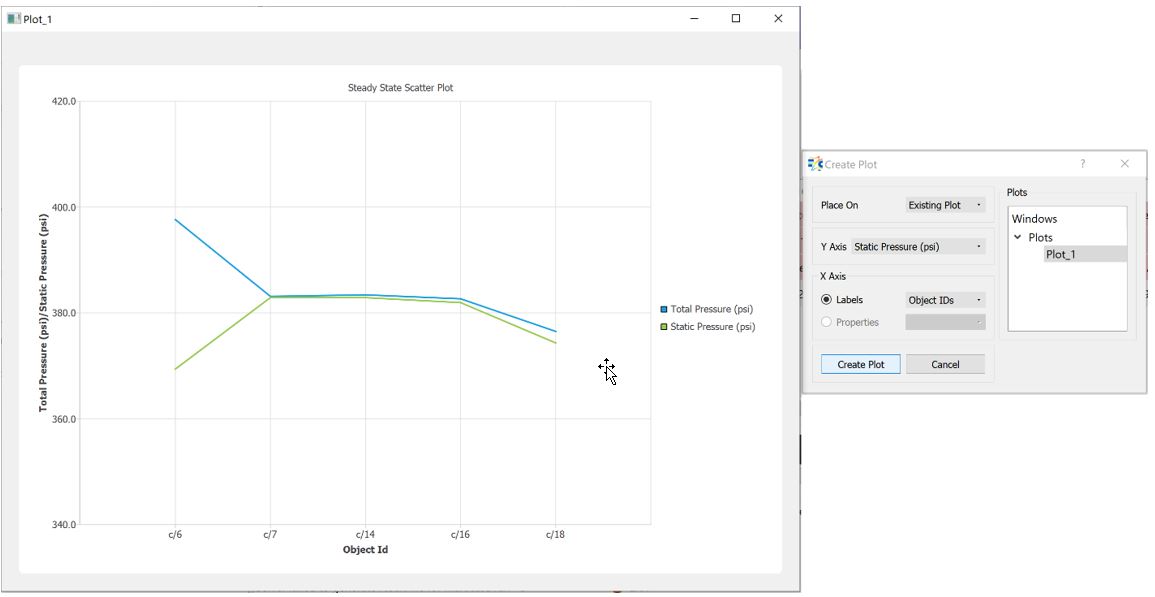
Y Axis shows the selected properties and it will be updated if new properties added onto existing plot. X Axis shows the Object IDs, and the objects are sorted the same way that are listed in the results table.
Transient Plots
Users can plot their transient analysis results. The steps for generating the plots are similar with the Steady State plots, except, here, the X Axis is Time series.
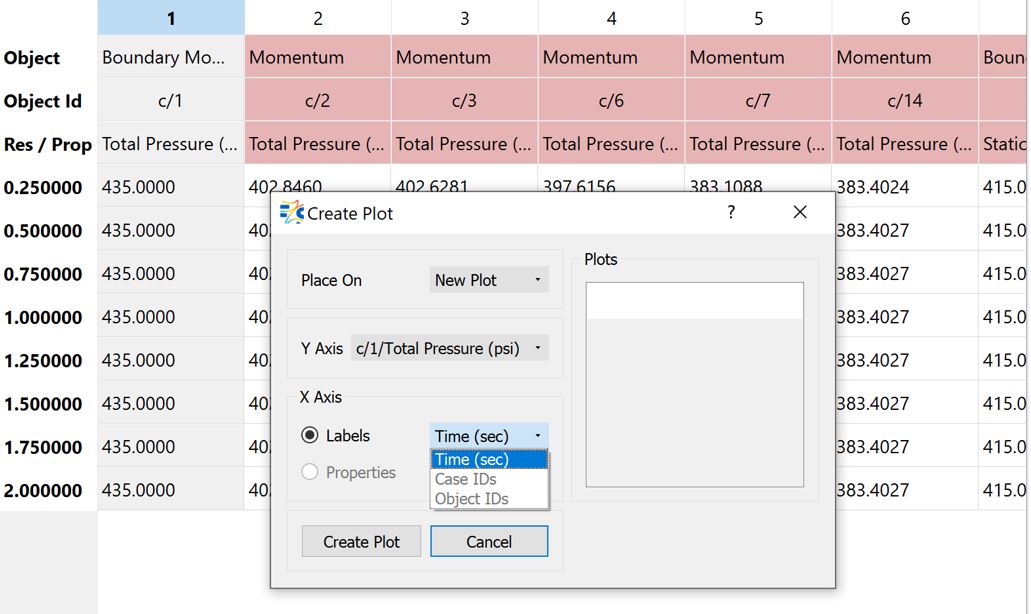
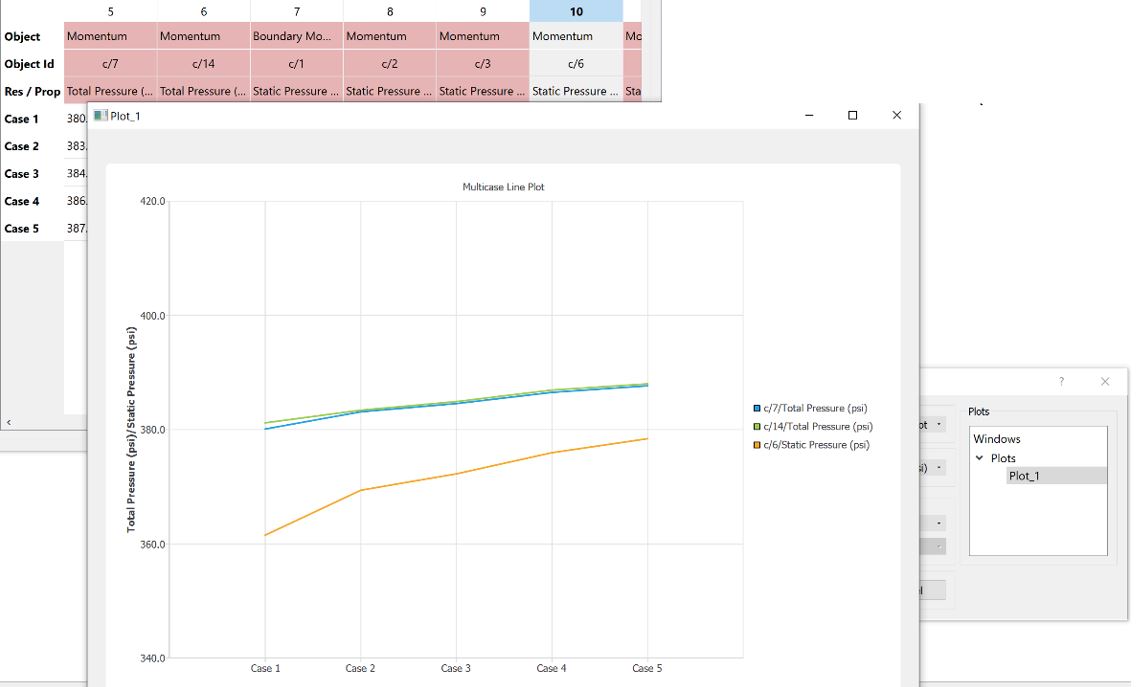
Multicase Plots with Case IDs on X Axis
After reading a multicase results folder, users can plot the results at each case. For Y axis users should select the property to be plotted and for X Axis, users should select Labels to show Case IDs. All other plotting options (new plot, existing plot) are also valid for multicase plots.
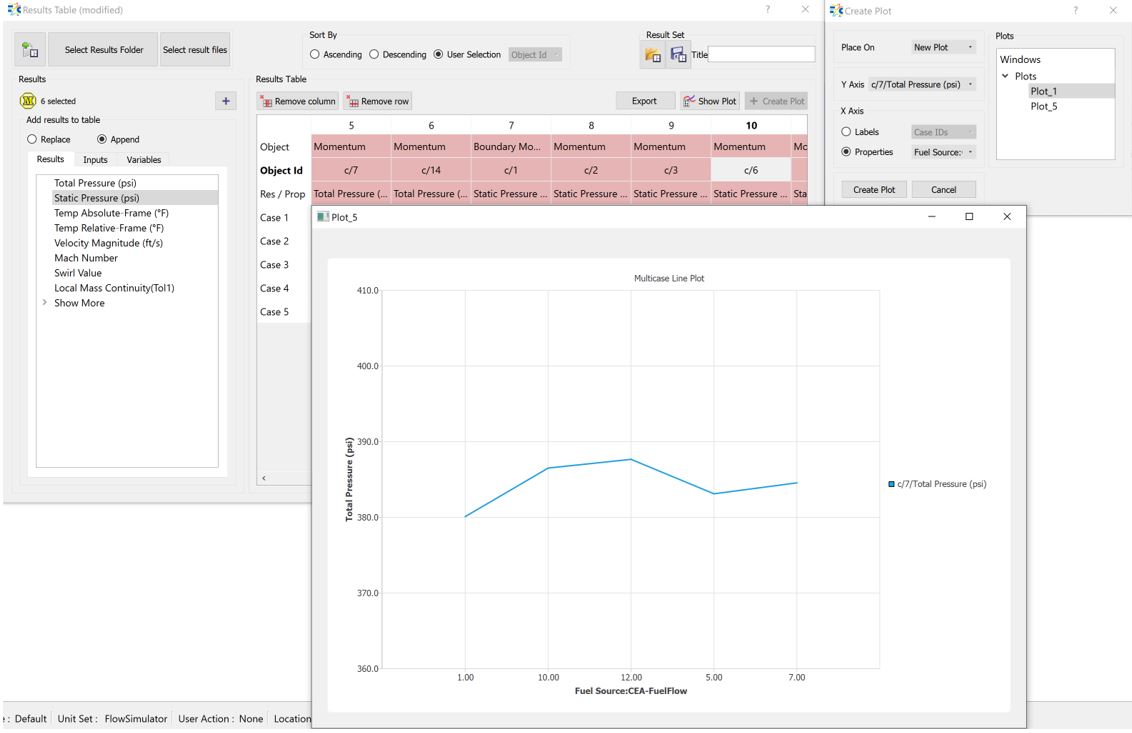
Multicase Plots with Case Variable on X Axis
In this plot type, instead of Case IDs, the multicase variable can be selected to be listed in X Axis. All other options are same with other plot types, except, after reading a multicase result folder, users should select Properties option to see the properties that are used to generate multicase file in the X Axis.
Plot Window Properties
Many new options are added for users to modify the axis, labels, fonts, and legends, moreover now users have options to zoom in/out, lock zoom and mouse hover. A right click on the Plot Window will list all the features.
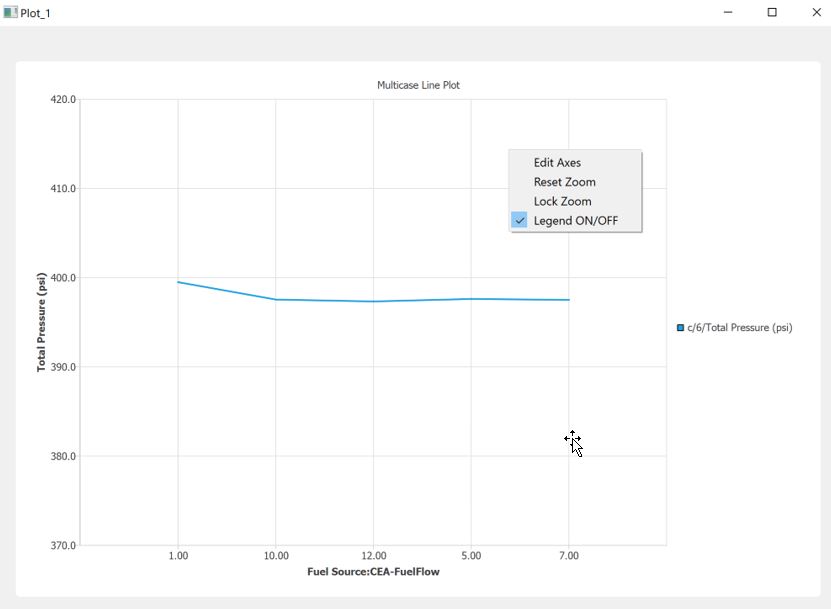
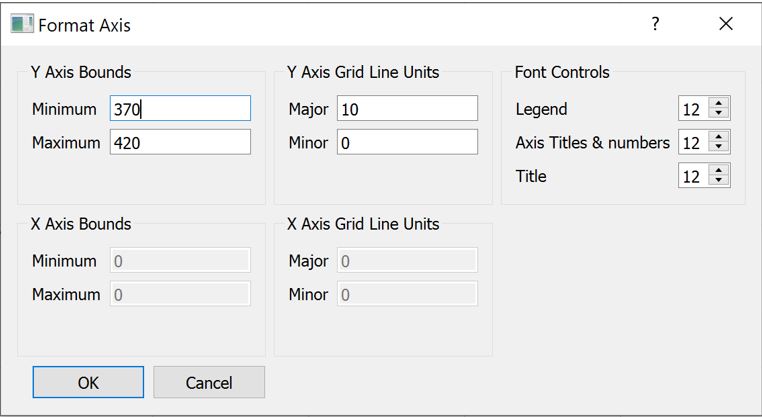
Edit Axes enables users to format the axes:
Reset Zoom resets the zoom to its initial bounds. If users change the bounds from Edit Axes window, this command resets back this change as well.
Lock Zoom Locks the zoom and disables mouse operations for zoom in/out.
Legend ON/OFF the legends are shown the plot window by default; however, users can remove with this option.