Contour/Transient Animation
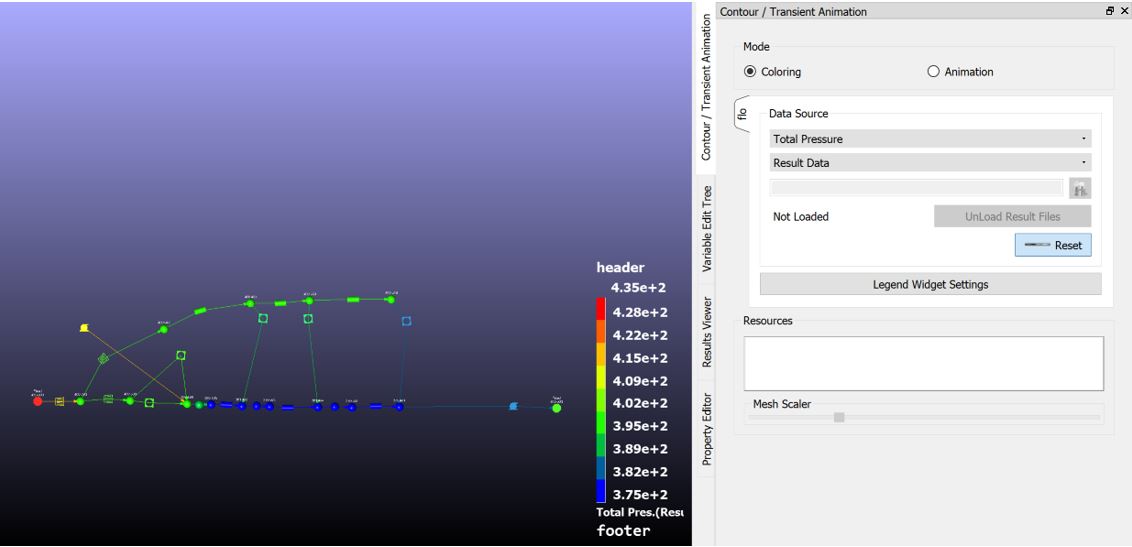
Use Flow Simulator's Contour and Transient Animation options to see the results of your model analysis on the Flow model as colored contours, or as a time animation for transient analysis. Use this tool to visualize common model inputs like restriction diameter or length, and to quickly check model inputs.
From the menu bar, select to use the options.
Colorize the Results in Flow Simulator
The Coloring option is located in the Contour/Transient Animation dialog. You can colorize either Initial Data or Result Data in Flow Simulator.
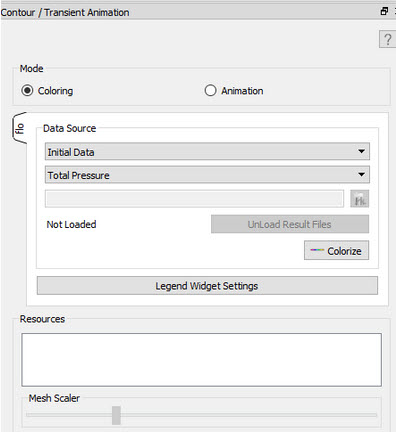
Perform a Transient Animation of the Results in Flow Simulator
In Flow Simulator, use the Animation option to see how the results change with time, elminating the need for an additional post-processing tool.
- Select this folder,
 , to
load the transient results.
, to
load the transient results. - Select the object property to be colorized.
- Select the Result Data.
- Define the animation speed by moving the bar between Slow and Fast.
- Click Play.
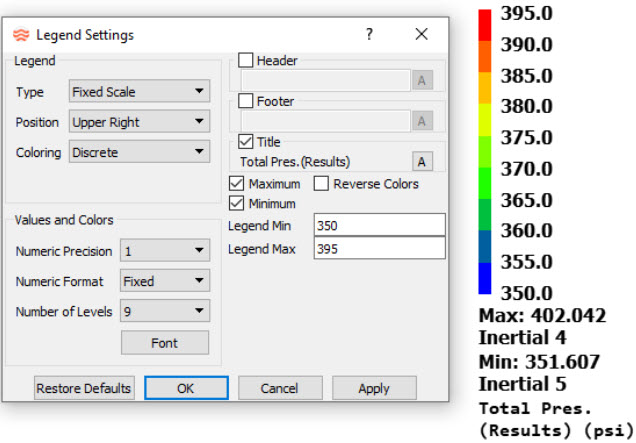
Legend Widget Settings
From the Contour/Transient Animation dialog, click Legend Widget Settings to display the Legend Settings dialog, where you can modify the legend settings for the color and animation options.