Chart
The user can view the trend chart of the selected product snapshot.
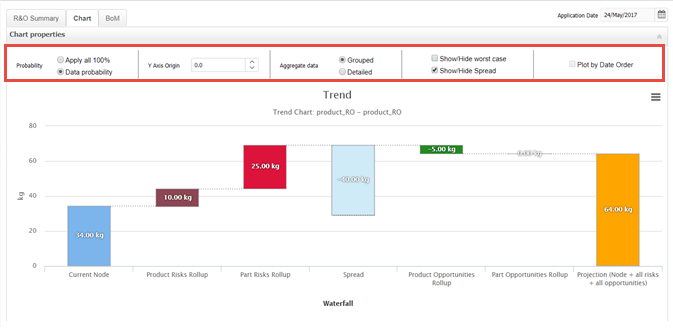
- The chart is enhanced with Spread information
- Spread is the difference between all opportunities and all risks
applied on a snapshot. Spread value is calculated using the below
formula:
totalProductOpportunitiy + totalPartOpportunitiy -
              (totalProductRisk + totalPartRisk)
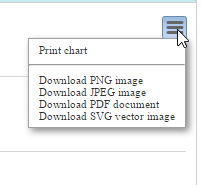
Chart Download Options
The available chart download options are shown in a context menu:
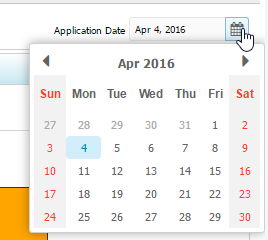
Application Date
User can select the date for the chart from the Application Date calendar option:
The following chart properties can be modified as per the user's requirements:
- Probability - The available probability chart view options are:
- Apply all 100%
- Data Probability
- Y axis origin
- Aggregate data - The available chart view options for the aggregate data are:
- Grouped - all the part risks consolidated in one bar in the chart.
- Detailed - the product risk and part risks are depicted in separate bars.
- Show/hide the worst case - shows or hides the worst case scenarios.
- Plot by Date Order - select this option to view the risks in bar chart by dates.