
Result Types
A set of result types is available for each of the four analysis stages: injection, foaming, curing and defects.
Injection Results
Review material behavior through the injection stage. Result types for this stage include: Temperature, Head ID, Material ID, Density, Polyol [mg KOH], Pressure, Velocity, Mold Temperature, Isocyanate [wt%], and Viscosity.
| Result Type | Description |
|---|---|
| Temperature | Review the temperature evolution of the material entering the
part cavity. Check regions for excessive heating or cooling.
Determine the appropriate fill speed for uniform temperature
distribution.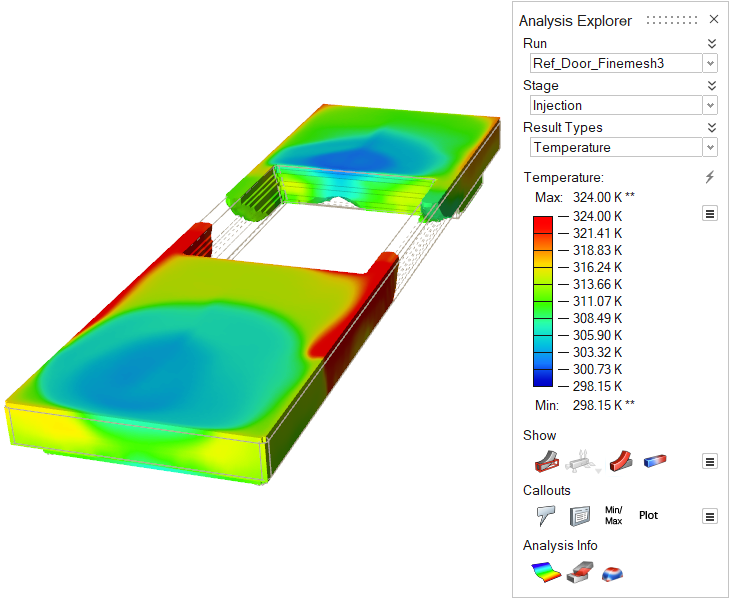 |
| Head ID | Review injection results for material coming from a
particular nozzle.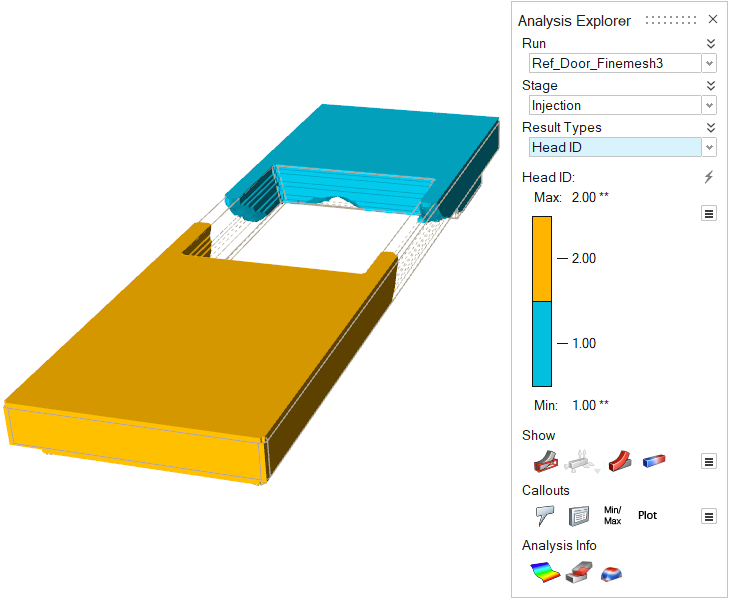 |
| Material ID | Review results for a particular material.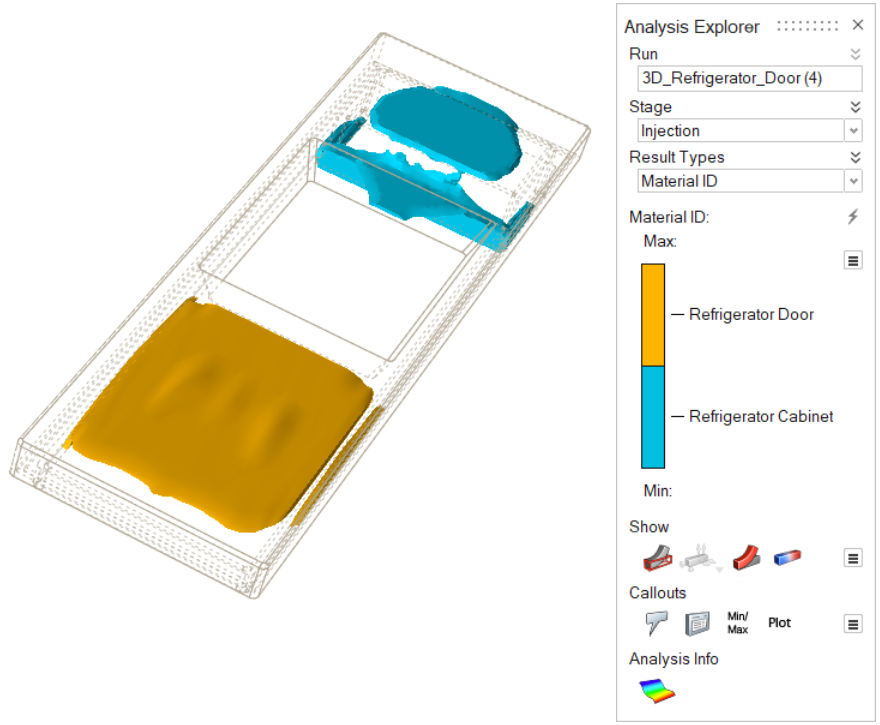 |
| Density | Consider material density through the progression of the
injection stage.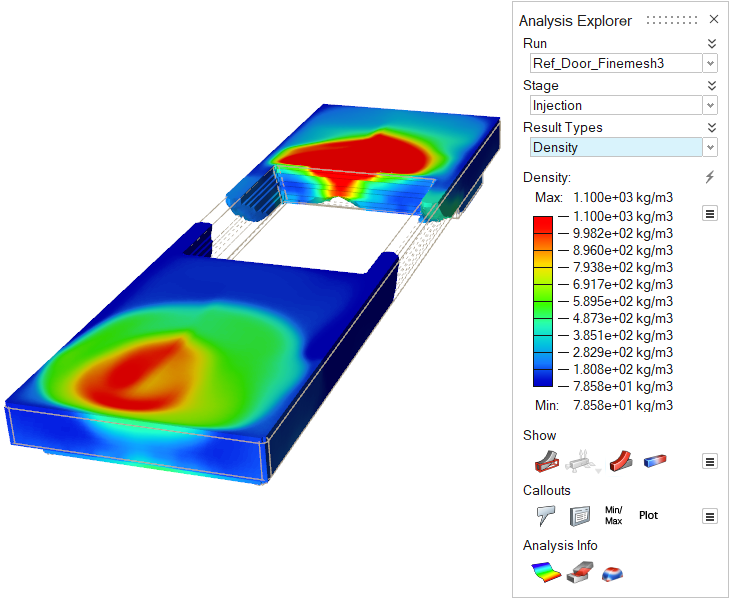 |
| Polyol [mg KOH] | Review the levels of polyol that remain in the material. The
initial level will be equal to the mixing ratio and will
decrease during the polyurethane reaction.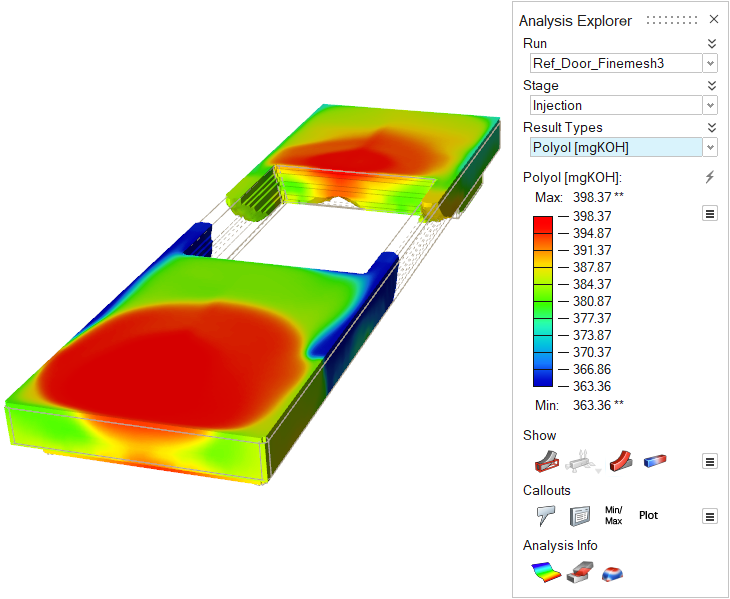 |
| Pressure | Review the impact of pressure on the material during the
injection stage.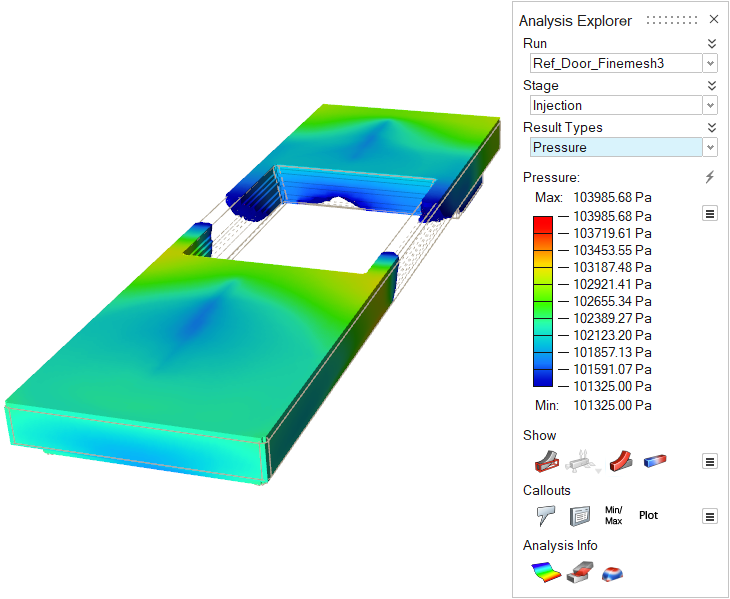 |
| Velocity | Review the velocity of the polyurethane material to detect
turbulences that can cause defects. Velocity is affected by
pressure, mold cavity shape, the polyurethane reaction itself,
and other factors. 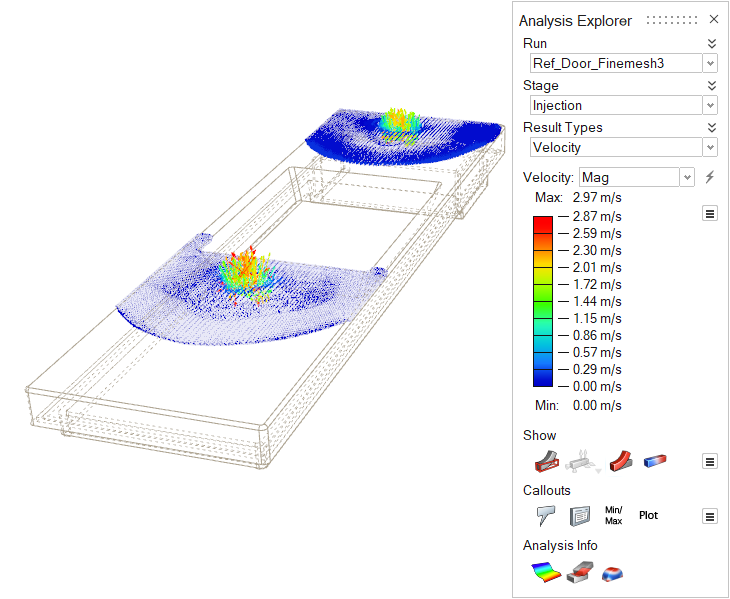 Note: To enable vectors, click the  icon under the Show heading in
the Analysis Explorer window, and enable Vector
Plot. icon under the Show heading in
the Analysis Explorer window, and enable Vector
Plot. |
| Mold Temperature | Review the temperature variance in the mold throughout the
injection stage. |
| Isocyanate [wt%] | Review the levels of isocyanate that remain in the
polyurethane material. The initial value will be equal to the
mixing ratio, and will decrease during the polyurethane
reaction. 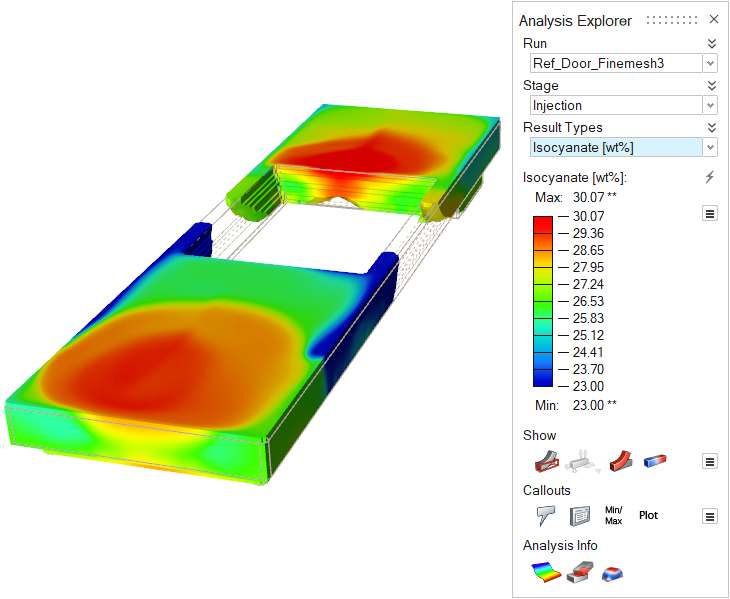 |
| Isocyanurate | Review the level of isocyanurate that is forming in the
polyurethane model. Polyisocyanurate requires a relatively high
temperature and an index greater than 180. (Find the material's
index in the Mixing Ratio tab in the Materials
window.) 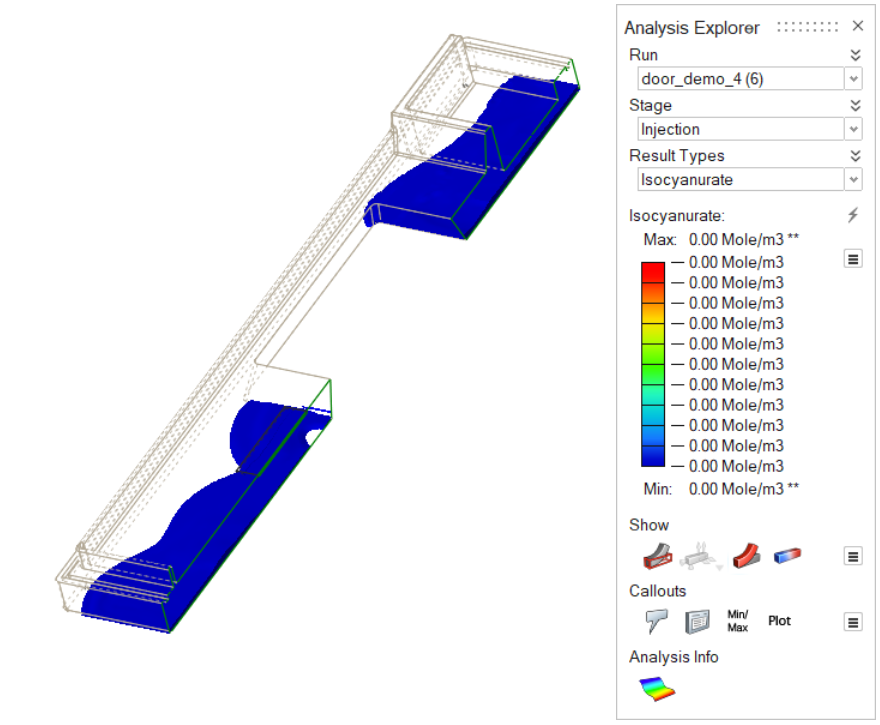 Note: To get
an isocyanurate result, you must:
|
| Viscosity | Review the dynamic viscosity of the polyurethane material.
Viscosity will increase over the course of the process.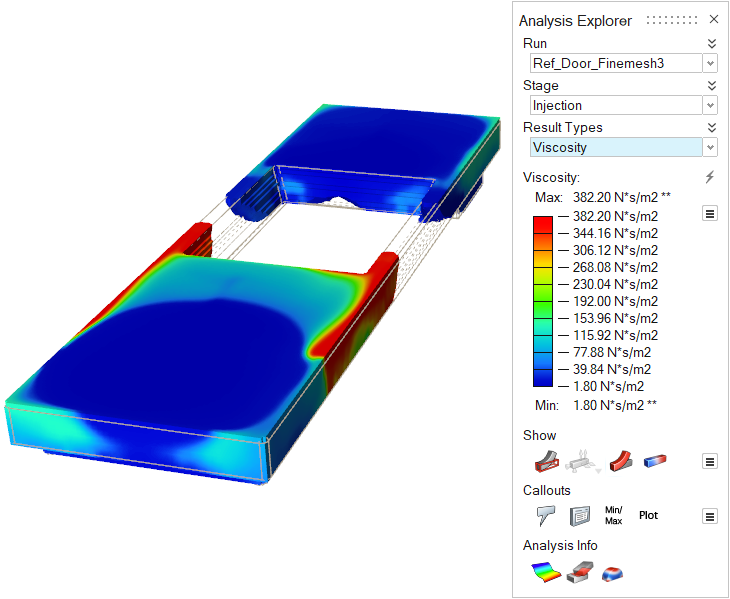 |
| Residual Stress | Residual stress is pressure from gas generated during the
foaming reaction without density change in the material.
Residual stress values will be low during the injection stage.
Temperature, foam density, and concentration of blowing agents
affect Residual Stress. This result is only available when rigid
polyurethane and a mold are in use. 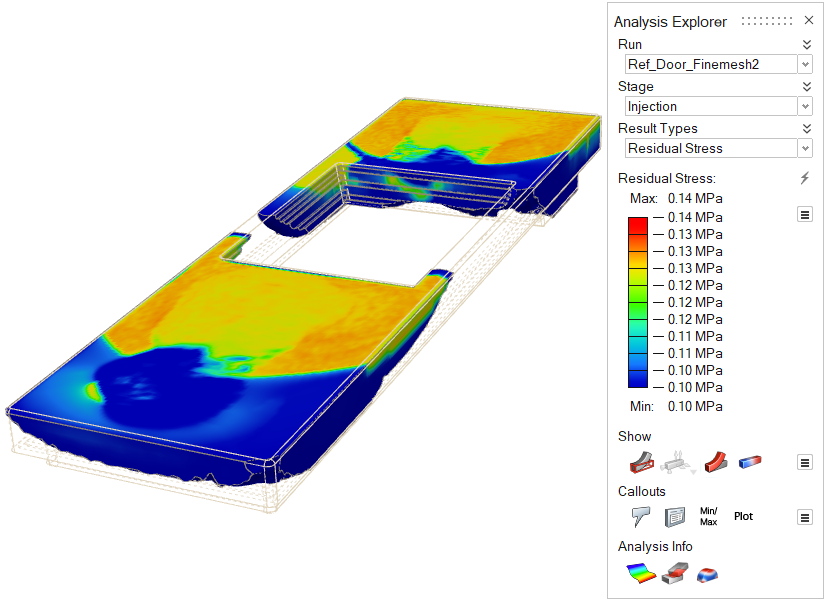 |
| Air Flow | View the behavior of air inside the mold during the injection
process. As material enters the cavity, air inside the mold
pushes out through vents, parting lines, and filling systems.
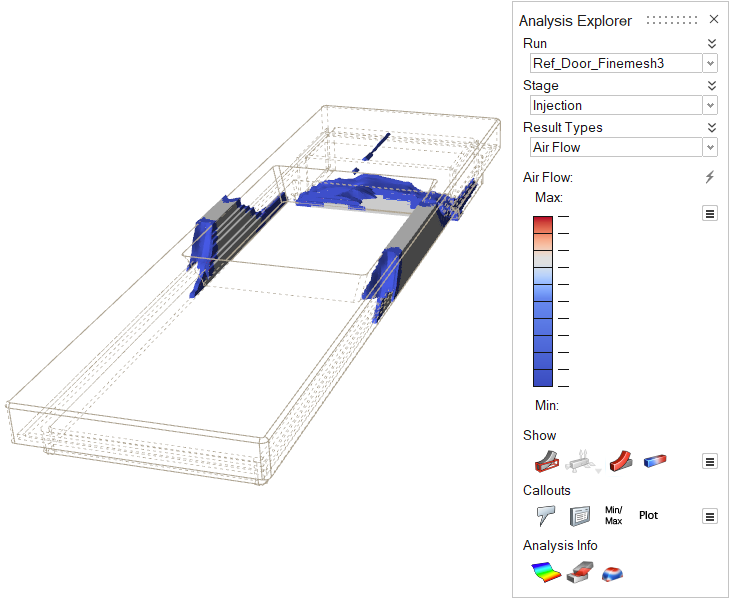 |
| Shear Rate | Review the rate at which a progressive shearing deformation
is applied to the material during the injection process. Because
the velocity difference is large and the shear rate increases on
the mold surface, you can use this result as an indicator of
surface defects along with the shear stress result. A high shear
rate generally indicates a lot of deformation. 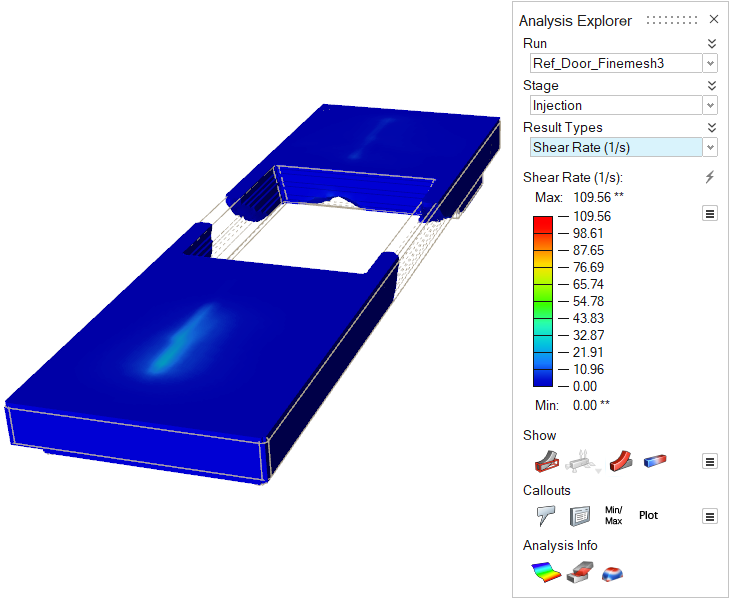 |
| Shear Stress | Shear stress is one of the forces that can cause deformation
of the material by slippage along a plane. You can use this
result along with the viscosity and shear rate results to
predict surface defects. You can also use this result as an
indicator for resistance to filling. |
Foaming Results
Review material behavior through the foaming stage. Result types for this stage include: Temperature, Head ID, Material ID, Density, Polyol [mg KOH], Pressure, Velocity, Isocyanate [wt%], and Viscosity.
| Result Type | Description |
|---|---|
| Temperature | Review the temperature evolution of the material during the
foaming stage.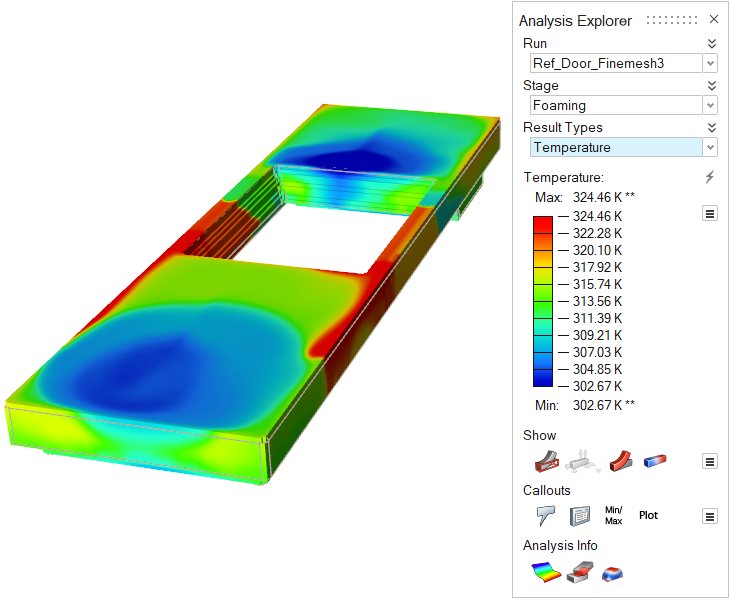 |
| Head ID | Review the foaming results for material coming from a
particular nozzle.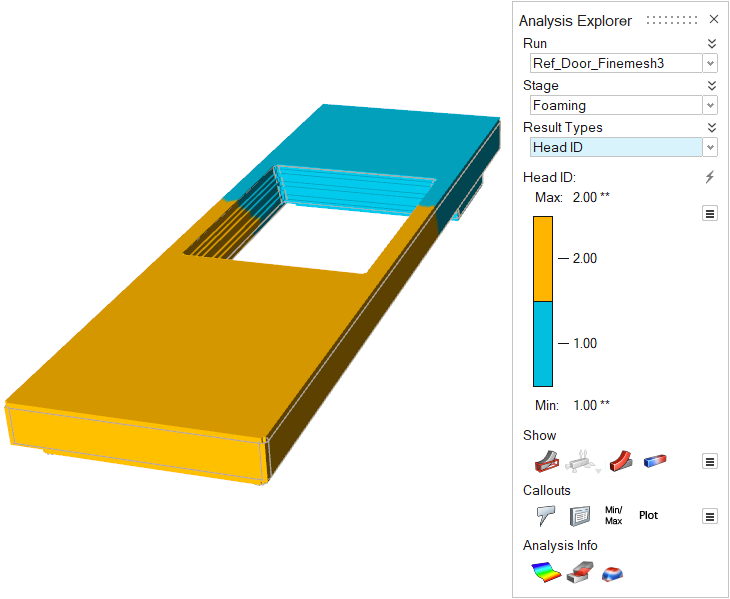 |
| Material ID | Review results for a particular material.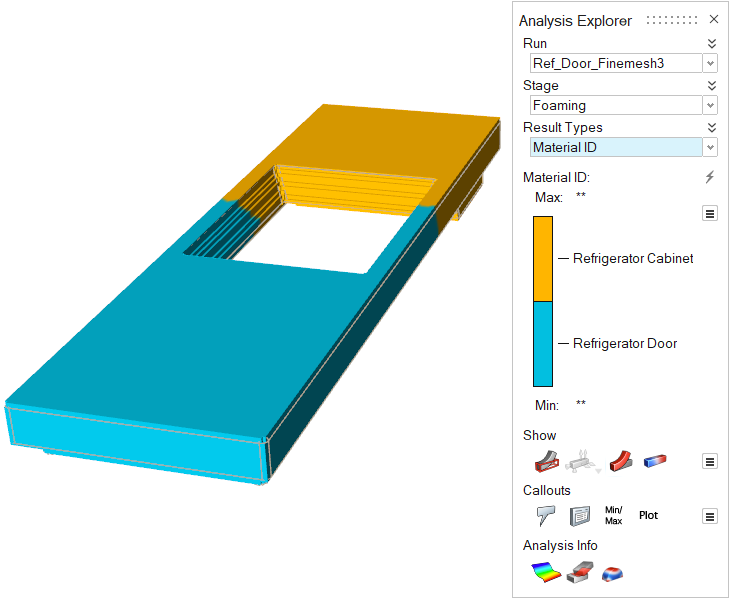 |
| Density | Consider material density through the progression of the
foaming stage.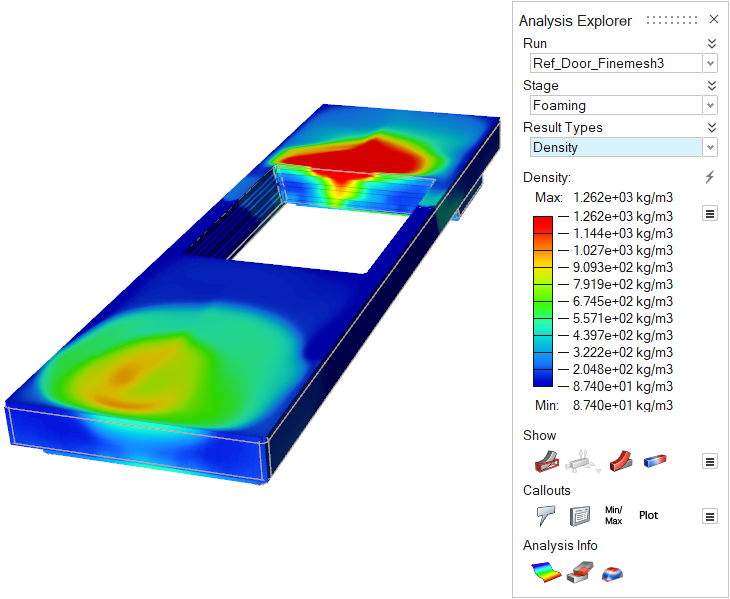 |
| Polyol [mg KOH] | Review the levels of polyol that remain in the material. The
initial level will be equal to the mixing ratio and will
decrease during the polyurethane reaction.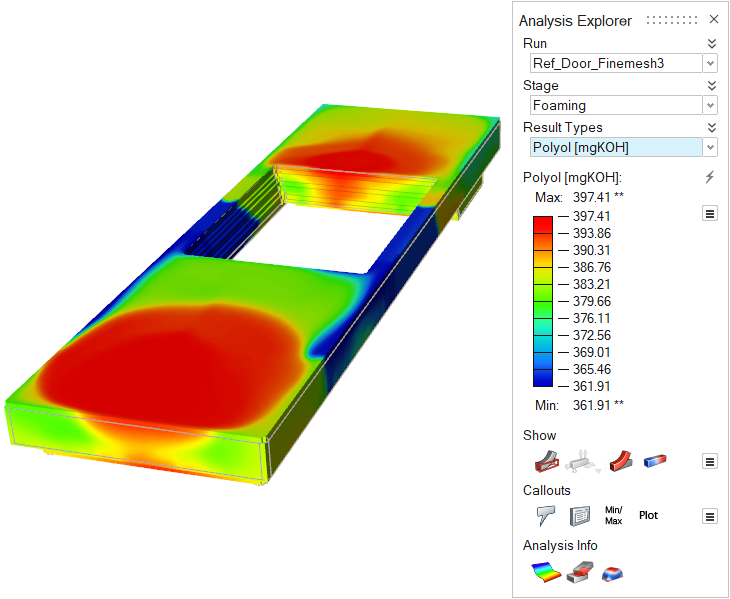 |
| Pressure | Review the impact of pressure on the material during the foaming stage.  |
| Velocity | Review the velocity of the polyurethane material to detect turbulences that can cause defects. Velocity is affected by pressure, mold cavity shape, the polyurethane reaction itself, and other factors. 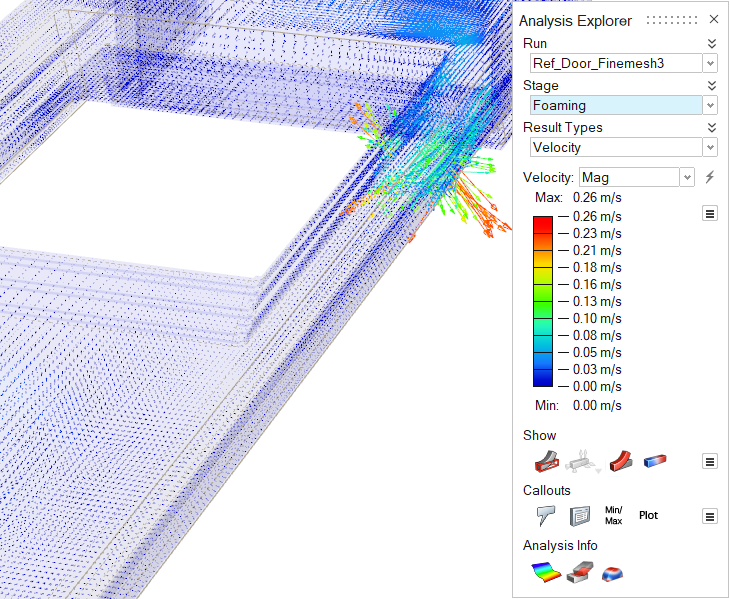 Note: To
enable vectors, click the icon under the Show heading in
the Analysis Explorer window, and enable Vector
Plot. |
| Isocyanate [wt%] | Review the levels of isocyanate that remain in the
polyurethane material. The initial value will be equal to the
mixing ration, and will decrease during the polyurethane
reaction. 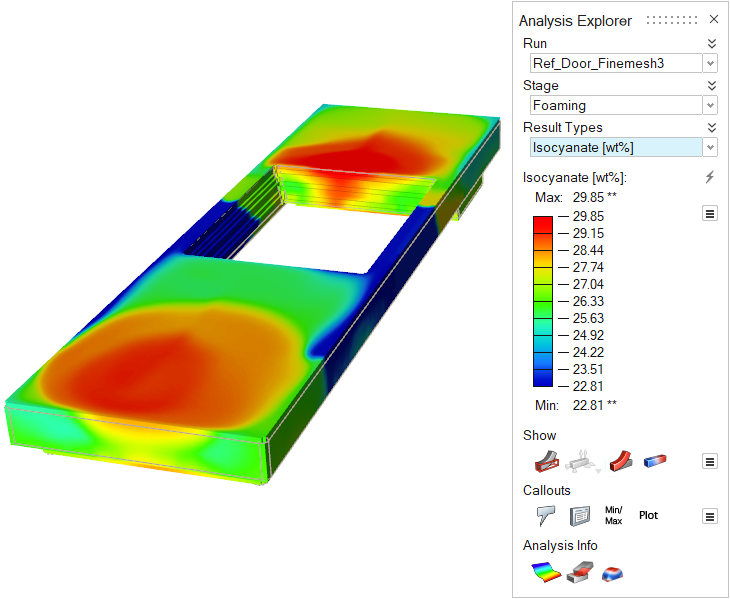 |
| Isocyanurate | Review the level of isocyanurate that is produced in the
polyurethane model.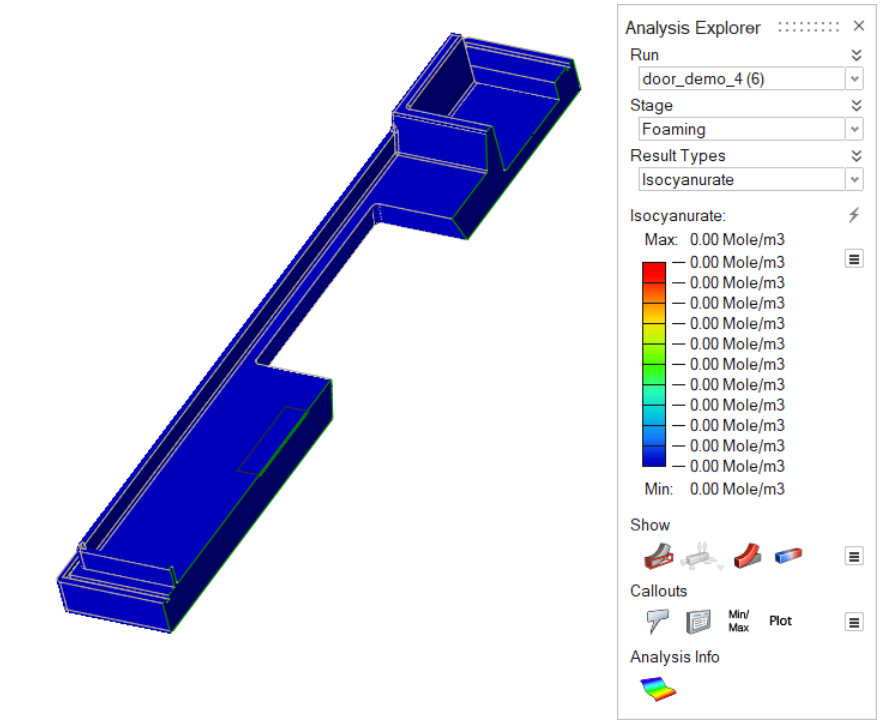 |
| Viscosity | Review the dynamic viscosity of the polyurethane material.
Viscosity will increase over the course of the process.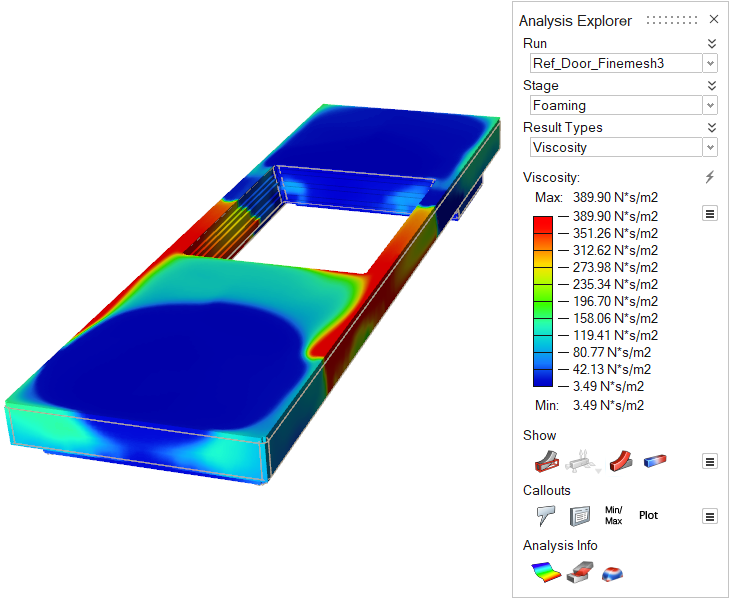 |
| Residual Stress | Residual stress is pressure from gas generated during the
foaming reaction without density change in the material.
Residual stress gradually decreases after reaching its maximum
value. Temperature, foam density, and concentration of blowing
agents affect Residual Stress. This result is only available
when rigid polyurethane and a mold are in use. 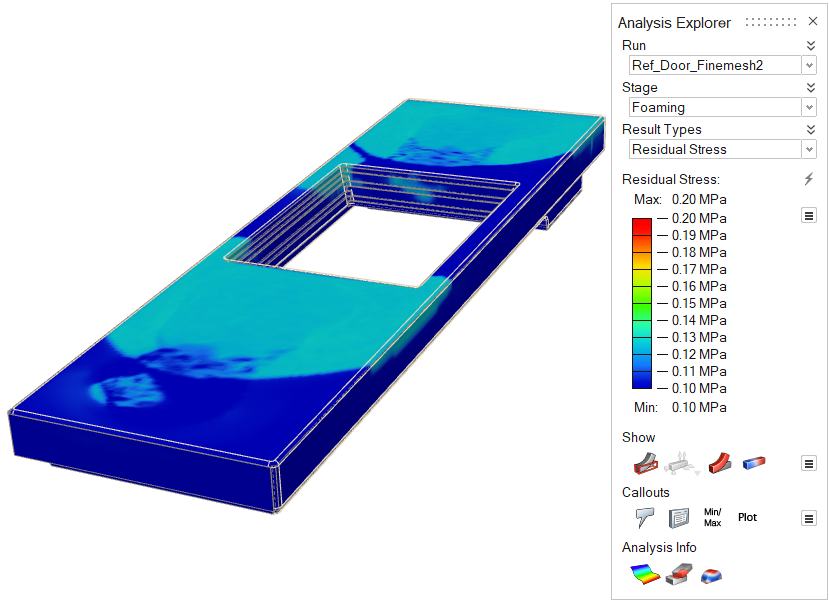 |
| Air Flow | View the behavior of air inside the mold during the foaming
process. As material fills the cavity, air inside the mold
pushes out through vents, parting lines, and filling systems.
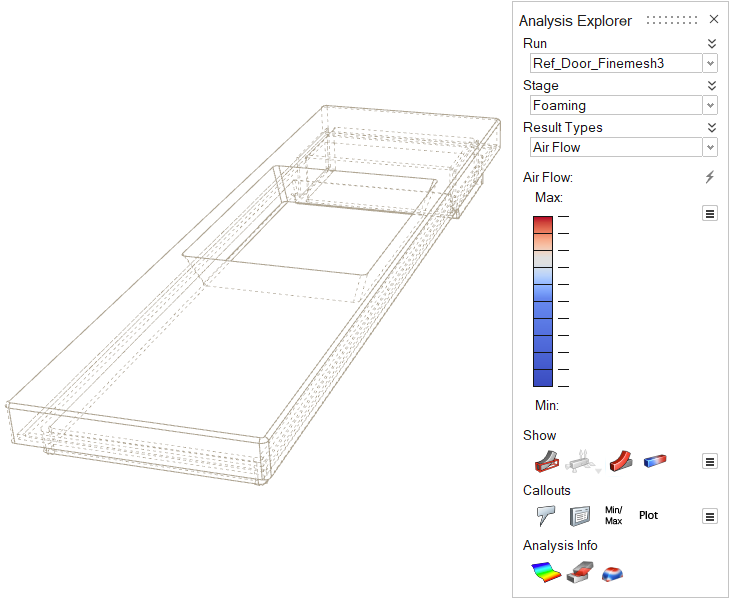 |
| Shear Rate | Review the rate at which a progressive shearing deformation
is applied to the material during the foaming process. Because
the velocity difference is large and the shear rate increases on
the mold surface, you can use this result as an indicator of
surface defects along with the shear stress result. A high shear
rate generally indicates a lot of deformation. 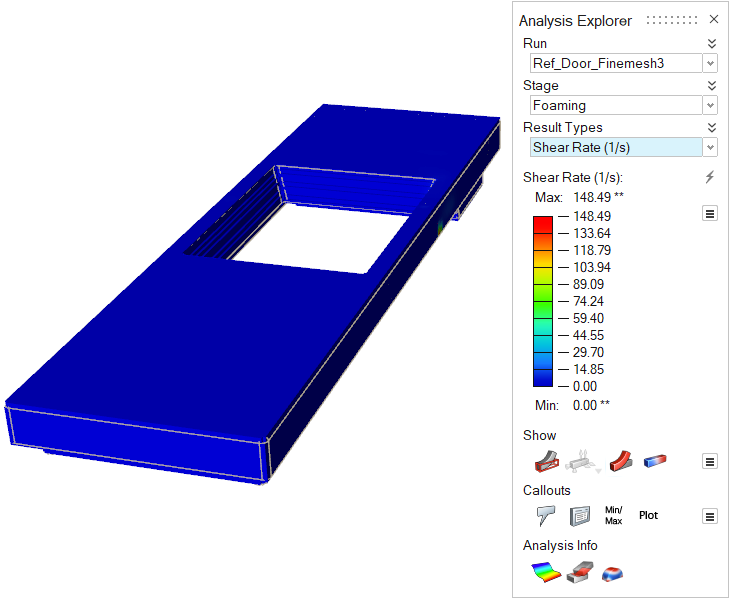 |
| Shear Stress | Shear stress is one of the forces that can cause deformation
of the material by slippage along a plane. You can use this
result along with the viscosity and shear rate results to
predict surface defects. 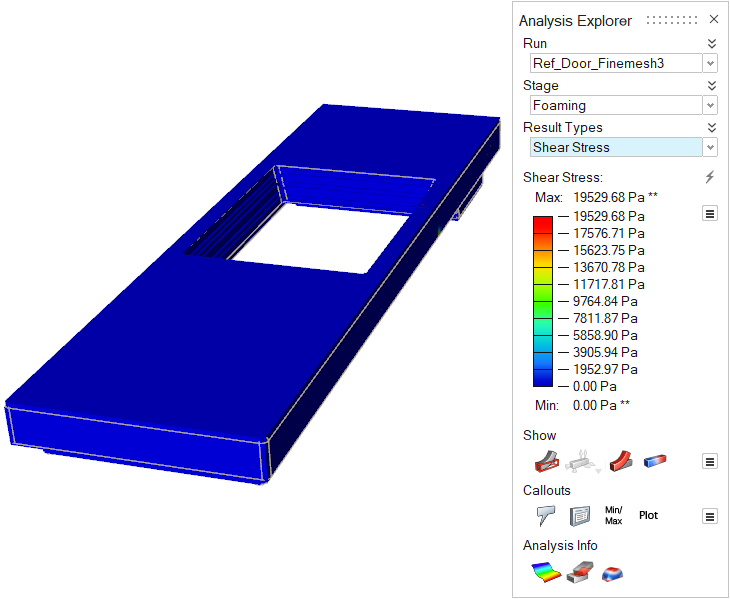 |
| Mold Temperature | Review the temperature variance in the mold throughout the
foaming stage. 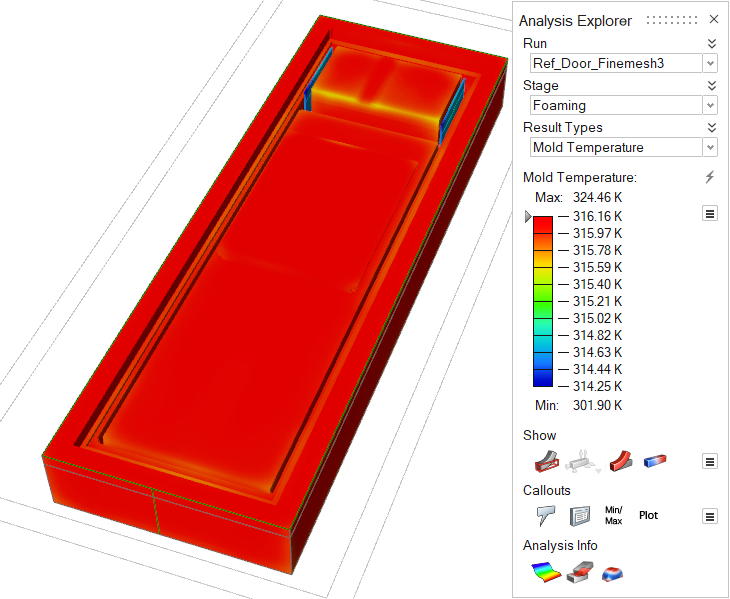 |
Curing Results
Review material behavior through the curing stage. Result types for this stage include: Temperature, Head ID, Material ID, Density, Polyol [mg KOH], Pressure, Isocyanate [wt%], and Viscosity.
| Result Type | Description |
|---|---|
| Temperature | Review the temperature evolution of the material during the
curing stage. Check regions for excessive heating or
cooling.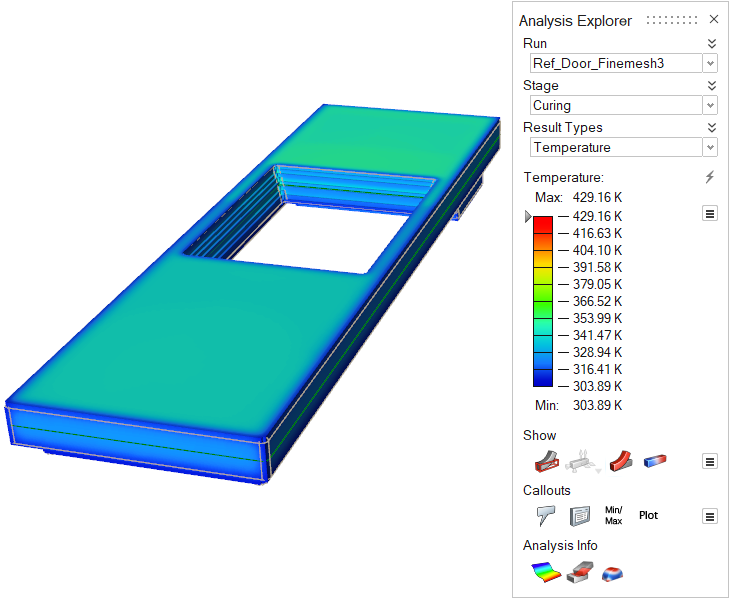 |
| Head ID | Review curing results for the material coming from a
particular nozzle.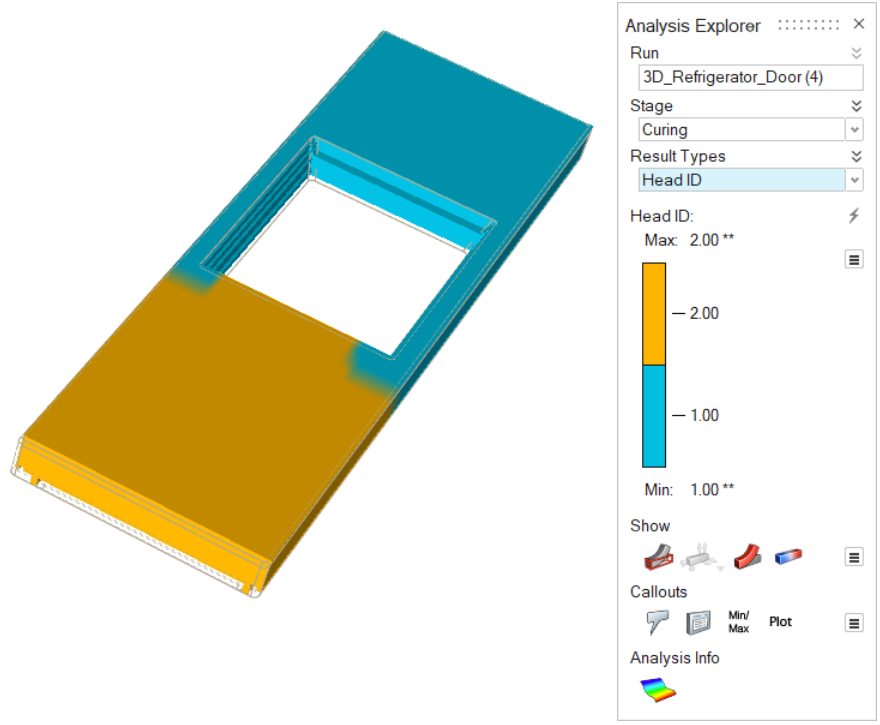 |
| Material ID | Review the curing results for a particular material.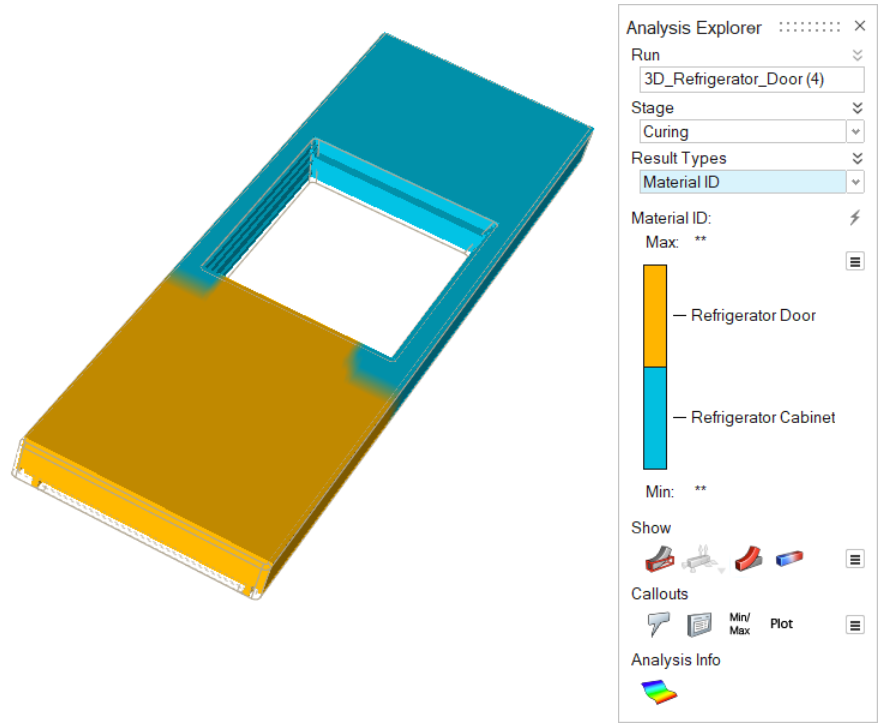 |
| Density | Consider material density during the curing stage.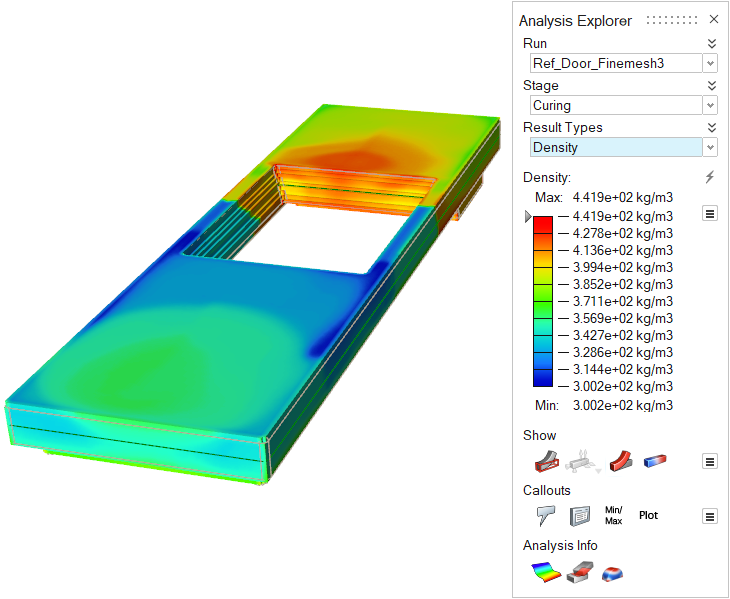 |
| Polyol [mgKOH] | Review the levels of polyol that remain in the material. The
initial level will be equal to the mixing ratio and will
decrease during the polyurethane reaction.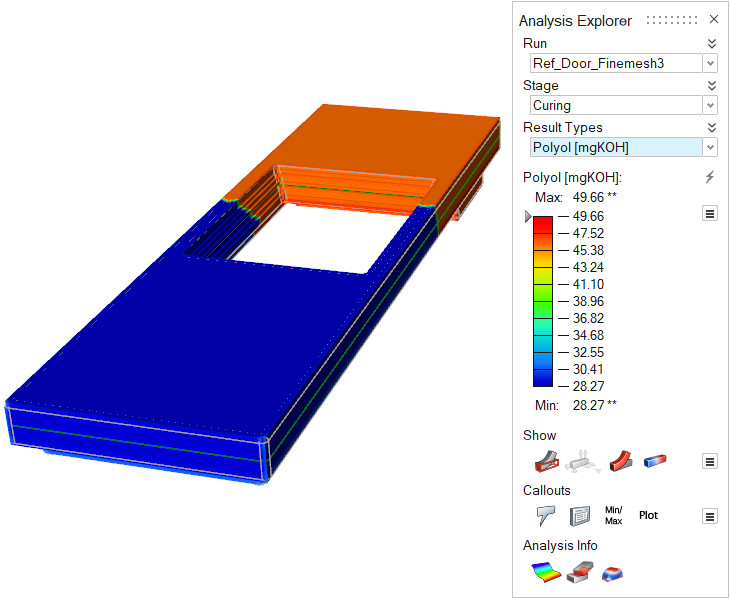 |
| Pressure | Review the impact of pressure on the material during the
curing stage.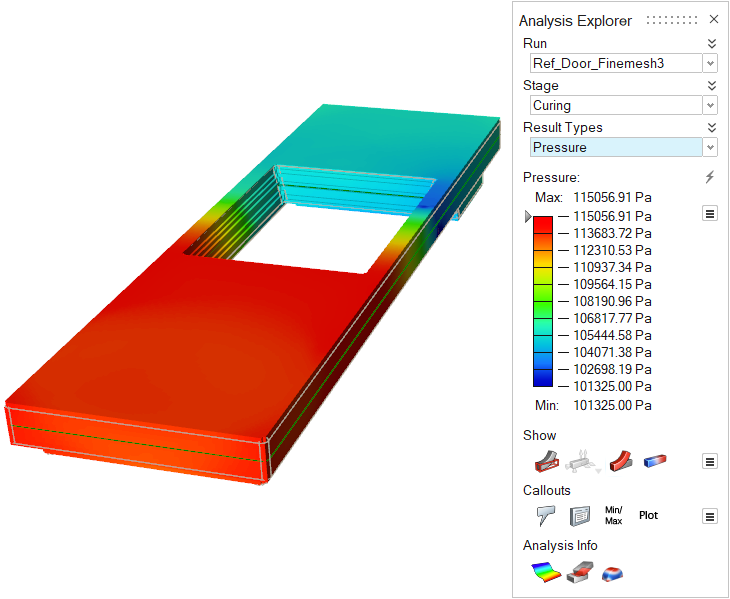 |
| Isocyanate [wt%] | Review the levels of isocyanate that remain in the
polyurethane material. The initial value will be equal to the
mixing ration, and will decrease during the polyurethane
reaction. 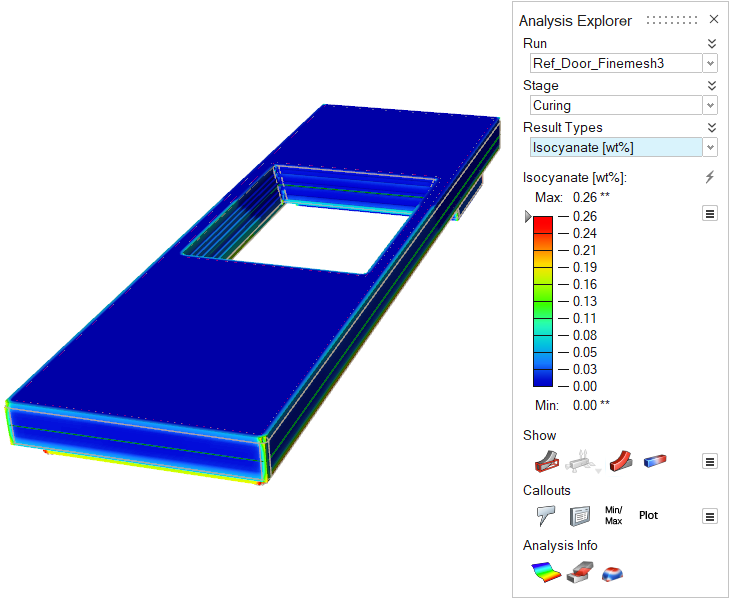 |
| Isocyanurate | Review the level of isocyanurate that is produced in the
polyurethane model.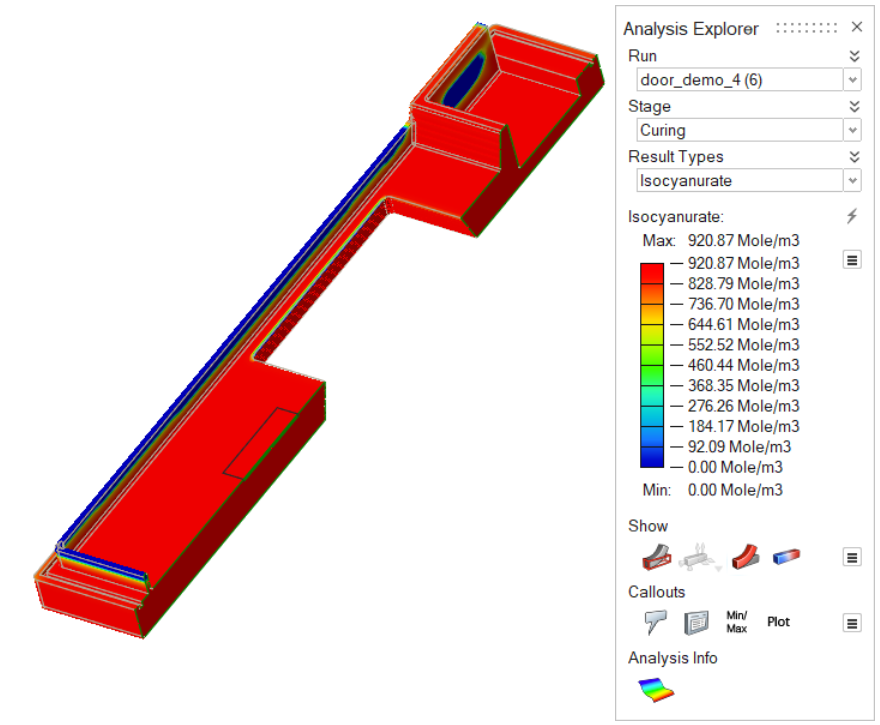 |
| Viscosity | Review the dynamic viscosity of the polyurethane material.
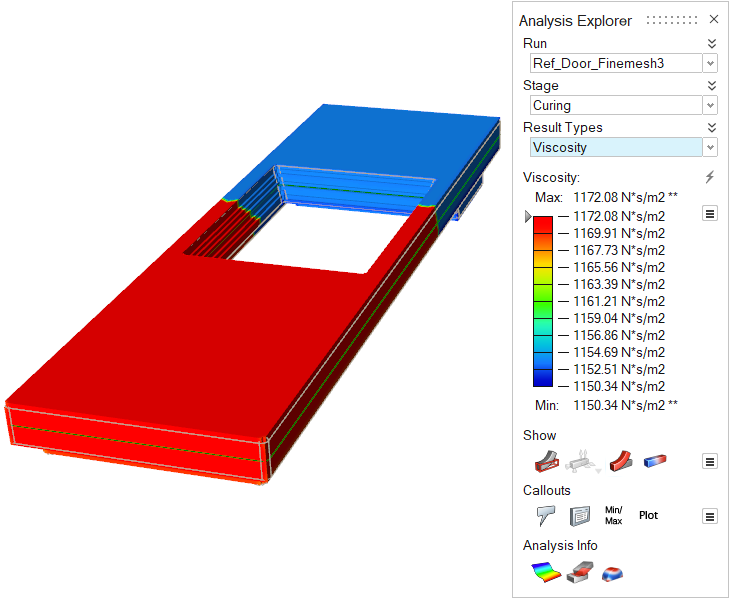 |
| Residual Stress | Residual stress is pressure from gas generated during the
foaming reaction without density change in the material.
Residual stress gradually decreases after reaching its maximum
value. Temperature, foam density, and concentration of blowing
agents affect Residual Stress. This result is only available
when rigid polyurethane and a mold are in use. 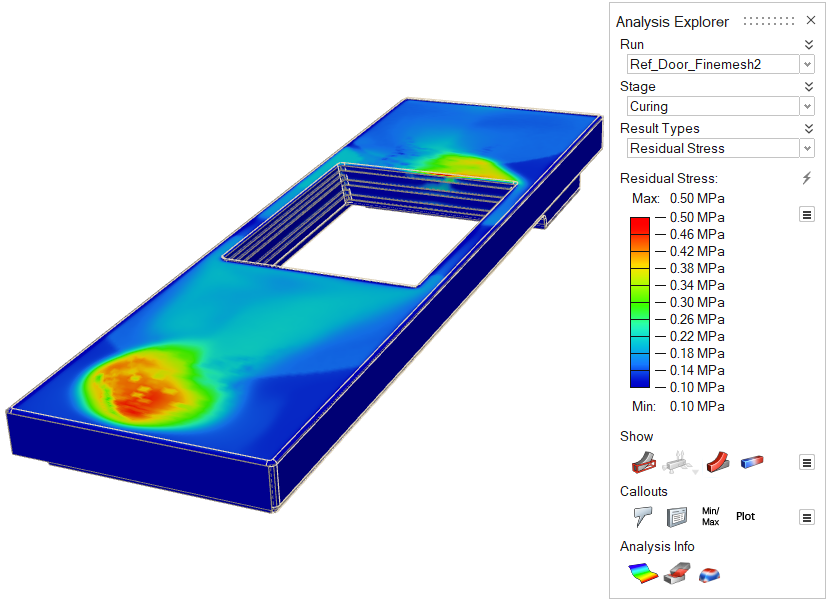 |
| Air Flow | View the behavior of air inside the mold during the curing
process. As material changes shape inside the cavity, air can
enter the mold through vents, parting lines, and filling
systems.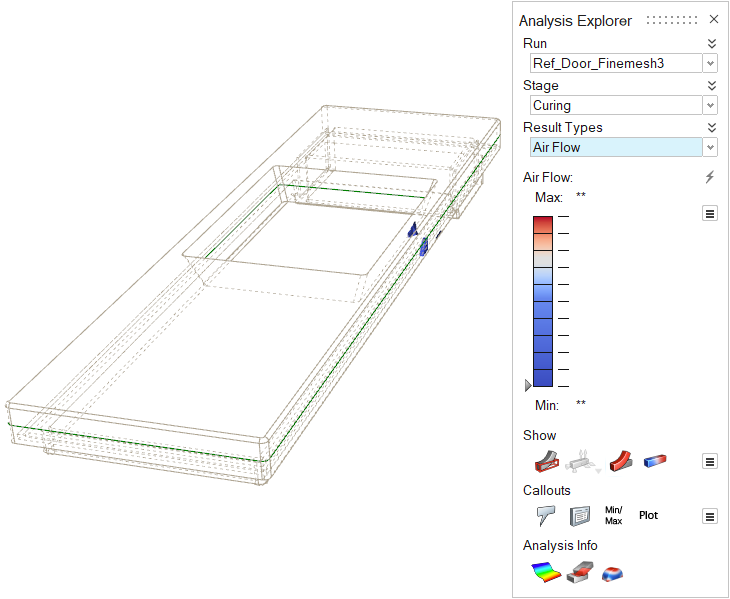 |
| Shear Rate | Review the rate at which a progressive shearing deformation
is applied to the material during the curing process. Because
the velocity difference is large and the shear rate increases on
the mold surface, you can use this result as an indicator of
surface defects along with the shear stress result.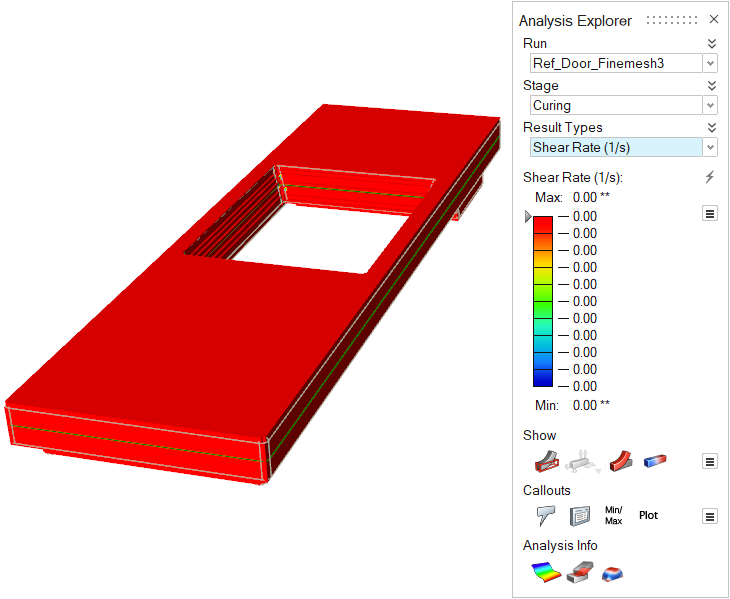 |
| Shear Stress | Shear stress is one of the forces that can cause deformation
of the material by slippage along a plane. You can use this
result along with the viscosity and shear rate results to
predict surface defects. 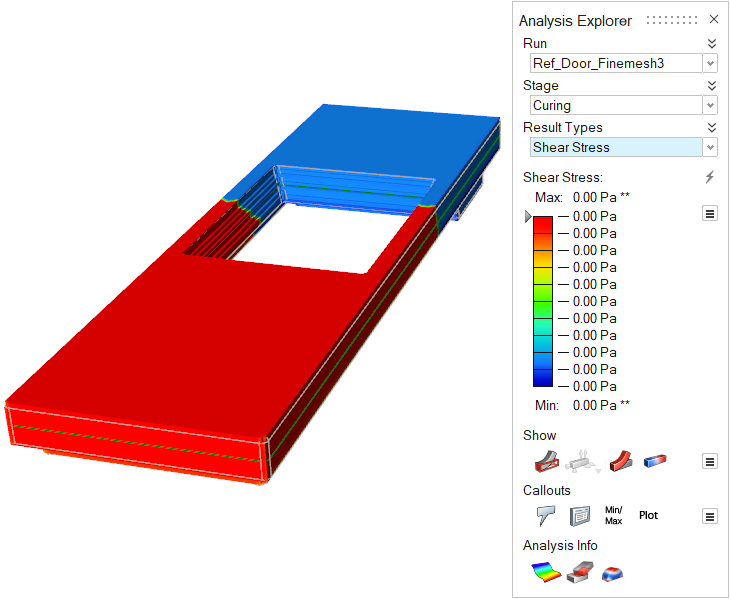 |
| Mold Temperature | Review the temperature variance in the mold throughout the
curing stage.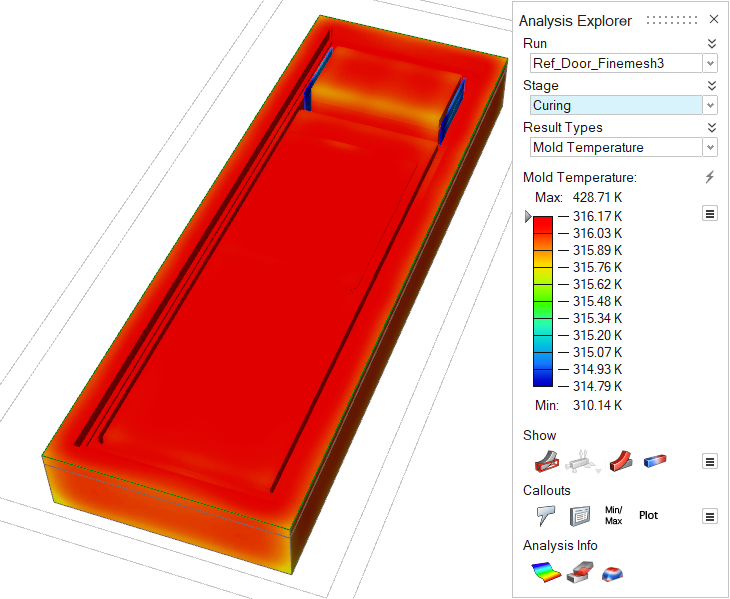 |
Defects Results
Review a range of defects that can occur at the end of the foaming process. Result types for this stage include: Air Pressure, Filling Time, Surface Defect Modulus, Shrinkage Defect Modulus, Weld Lines, and Weld Lines Movement.
| Option | Description |
|---|---|
| Air Pressure | Display the accumulated air pressure effects on the part at
the end of the simulation. Look for porosity and void
defects. |
| Filling Time | Review the time the material takes to reach different areas of the mold. Consider adjustments to the nozzle paths and tooling. 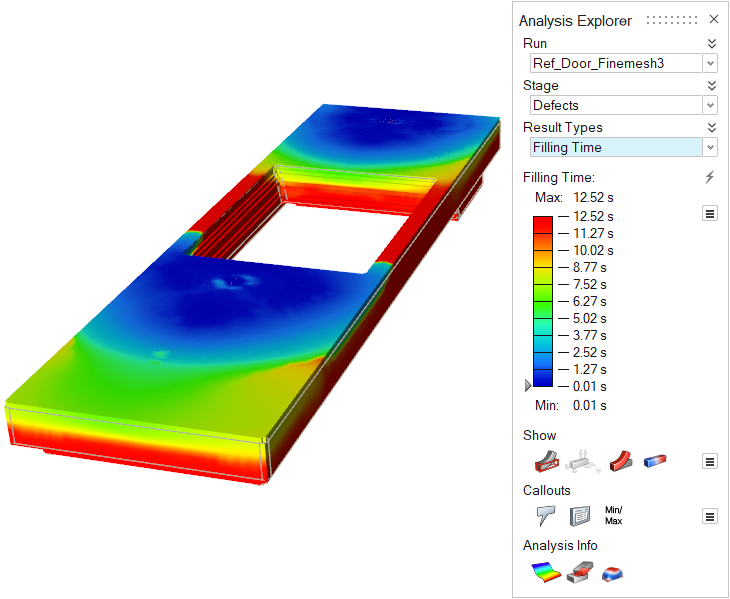 |
| Surface Defect Modulus | Review the surface of the foam part for coarseness, toughness
and melting that could be due to high mold temperatures, poor
sealing, undried demolding spray, or contaminants. Consider
controlling the mold temperature or modifying the sealing
process. These surface defects can occur when a highly viscous
foam flows through the mold.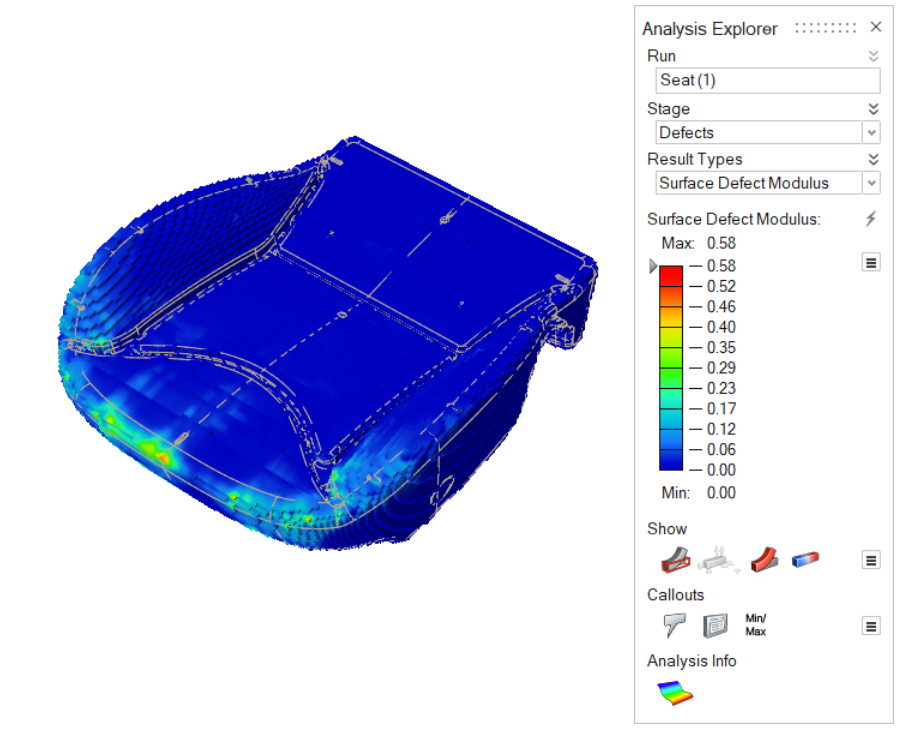 The Surface Defect Modulus is
dimensionless, and the result is displayed only on the
surface between the part and mold. The following example,
where (a) is 20℃, (b) is 40℃, and (c) is 60℃, shows a defect
area that increases as the mold temperature increases. 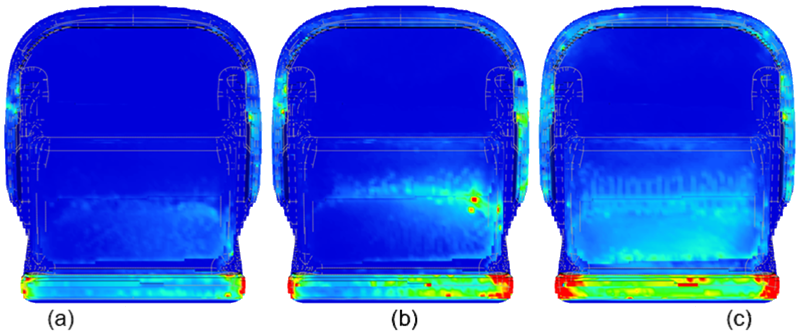 |
| Shrinkage Defect Modulus | To produce results that predict the Shrinkage Defect Modulus,
you must select Time as an ending
condition when defining the Process Parameters for your
analysis. A shrinkage defect can occur if the polyurethane
foam is too soft during the molding process or after
demolding. Shrinkage can occur due to over-packing, slow
gelling, and low index. Note that the shrinkage defect model
is appropriate for flexible, polyurethane foam only, not
rigid polyurethane foam. 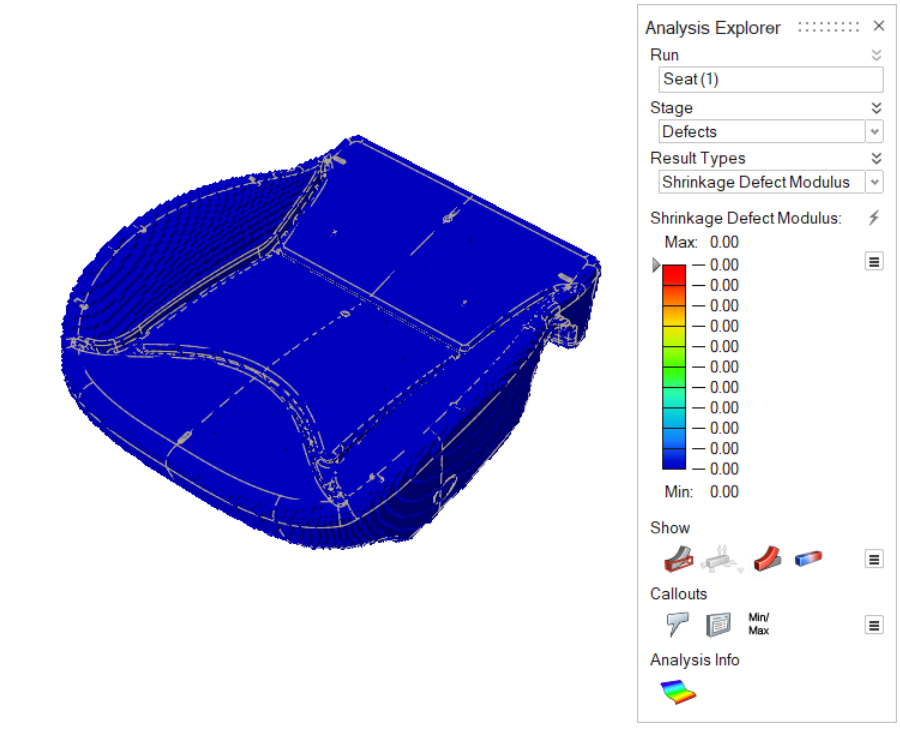 The following examples show model results where (a) the mold is 40℃, (b) the mold is 20℃, (c) the temperature is shown through the cross-section of the part, and (d) the mold is 20℃ and the shrinkage modulus is shown. No shrinkage occurs when
the mold temperature is 40℃ (a). However, when the mold
temperature dips to 20℃, shrinkage occurs as shown in (b).
Looking at the cross-section (c), shrinkage occurs mainly on
the outer surface of the part because the surface
temperature is lower than the core temperature. 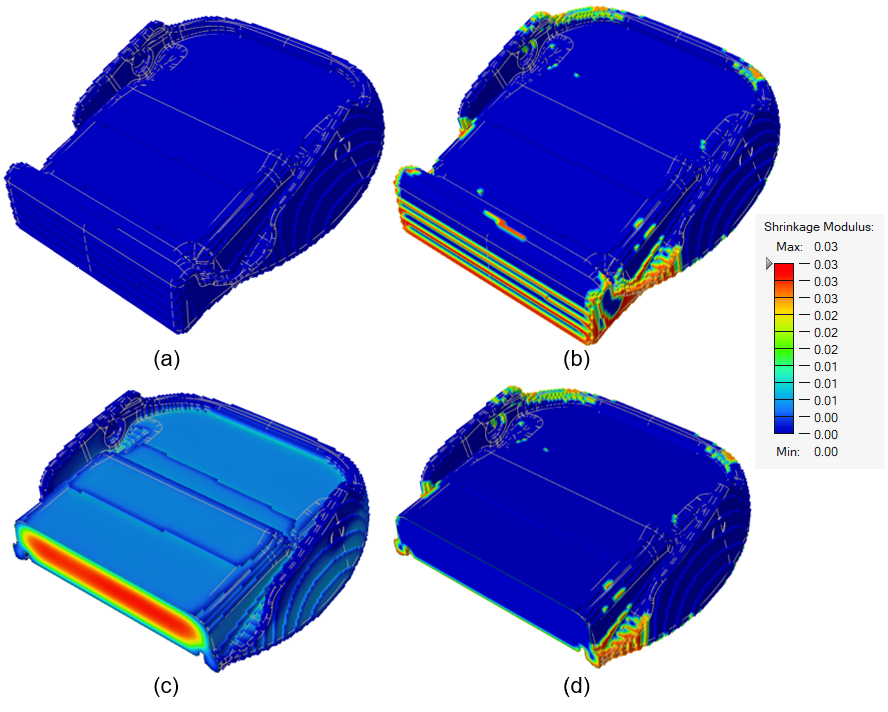 |
| Weld Lines | Weld lines occur when two separate fluid streams recombine as
a result of multiple nozzles or the shape of the part. Material
does not bond perfectly along weld lines, which can cause
cosmetic imperfections and structural weakness. The Weld Lines
result shows the initial position of weld lines in the
part.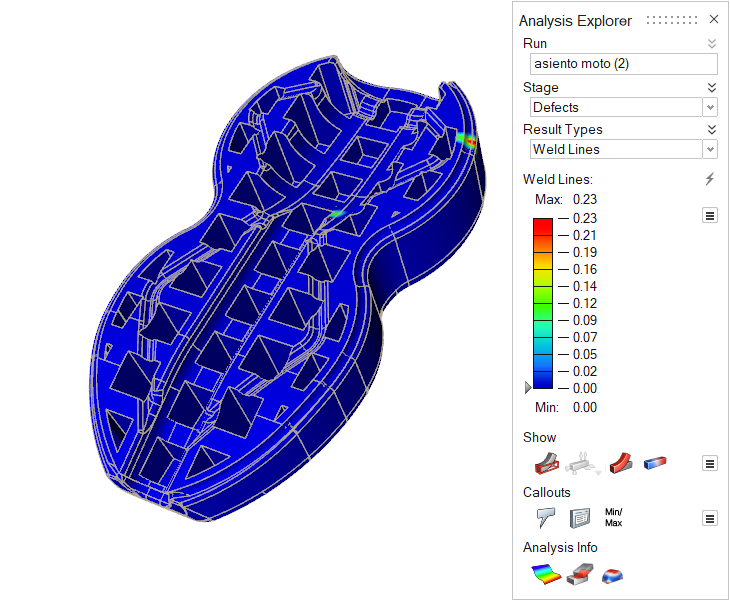 |
| Weld Lines Movement | Weld lines can shift position as the foam expands. The Weld
Lines Movement result shows the final position of weld lines in
the part.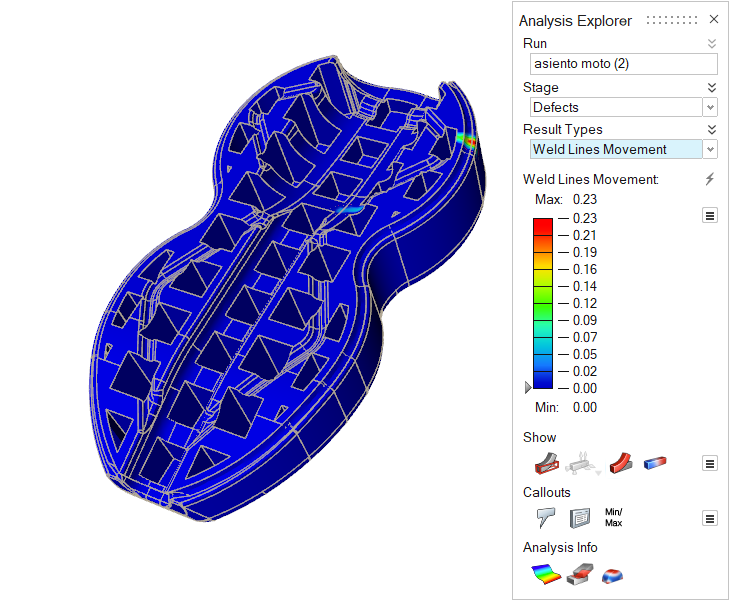 |