View Cuts
This option allows the user to visualize a plot of the sound pressure values at a given frequency, step and speed of sound with respect to the cut of observation points. When this option is selected, the following panel is shown:
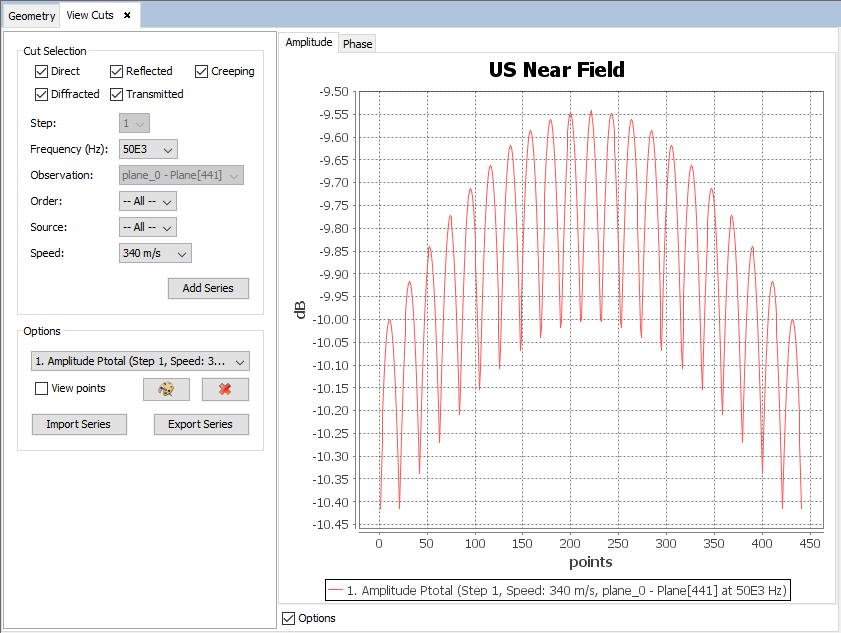
In this panel, the user can select the effects of the rays used to calculate the field, the parametric step, the frequency, the set of observation points, the order of the considered rays, the source and the speed of sound. By pressing the "Add Series" button, a new plot will be added to the panel.
It is also possible to visualize the phase of the field values by selecting the "Phase" tab in the chart panel.
The user can also manage the already added series, being able to do actions such as removing series, changing the color of series or importing and exporting series from/to text files.