View Ray Tracing
This option allows the user to view the rays emitted by the source of the simulation that end up reaching an observation point.
When open, the panel will display the rays for a particular step, order, source, observation point and speed. All the effects are selected by default. The possible configuration options are:
- The parametric step the results are visualized for.
- Ray effect: The user can filter the rays shown in the geometry panel by selecting the effects of the rays they want to visualize.
- Order: The order of the displayed rays. The order of a ray corresponds to the number of bounces it makes before reaching the observation point.
- Source: The ultrasound source that generates the rays the user wants to visualize.
- Point: The point where the visualized rays impact, or "All" to see the rays of all observation points.
- Speed: The speed of sound the results are visualized for.
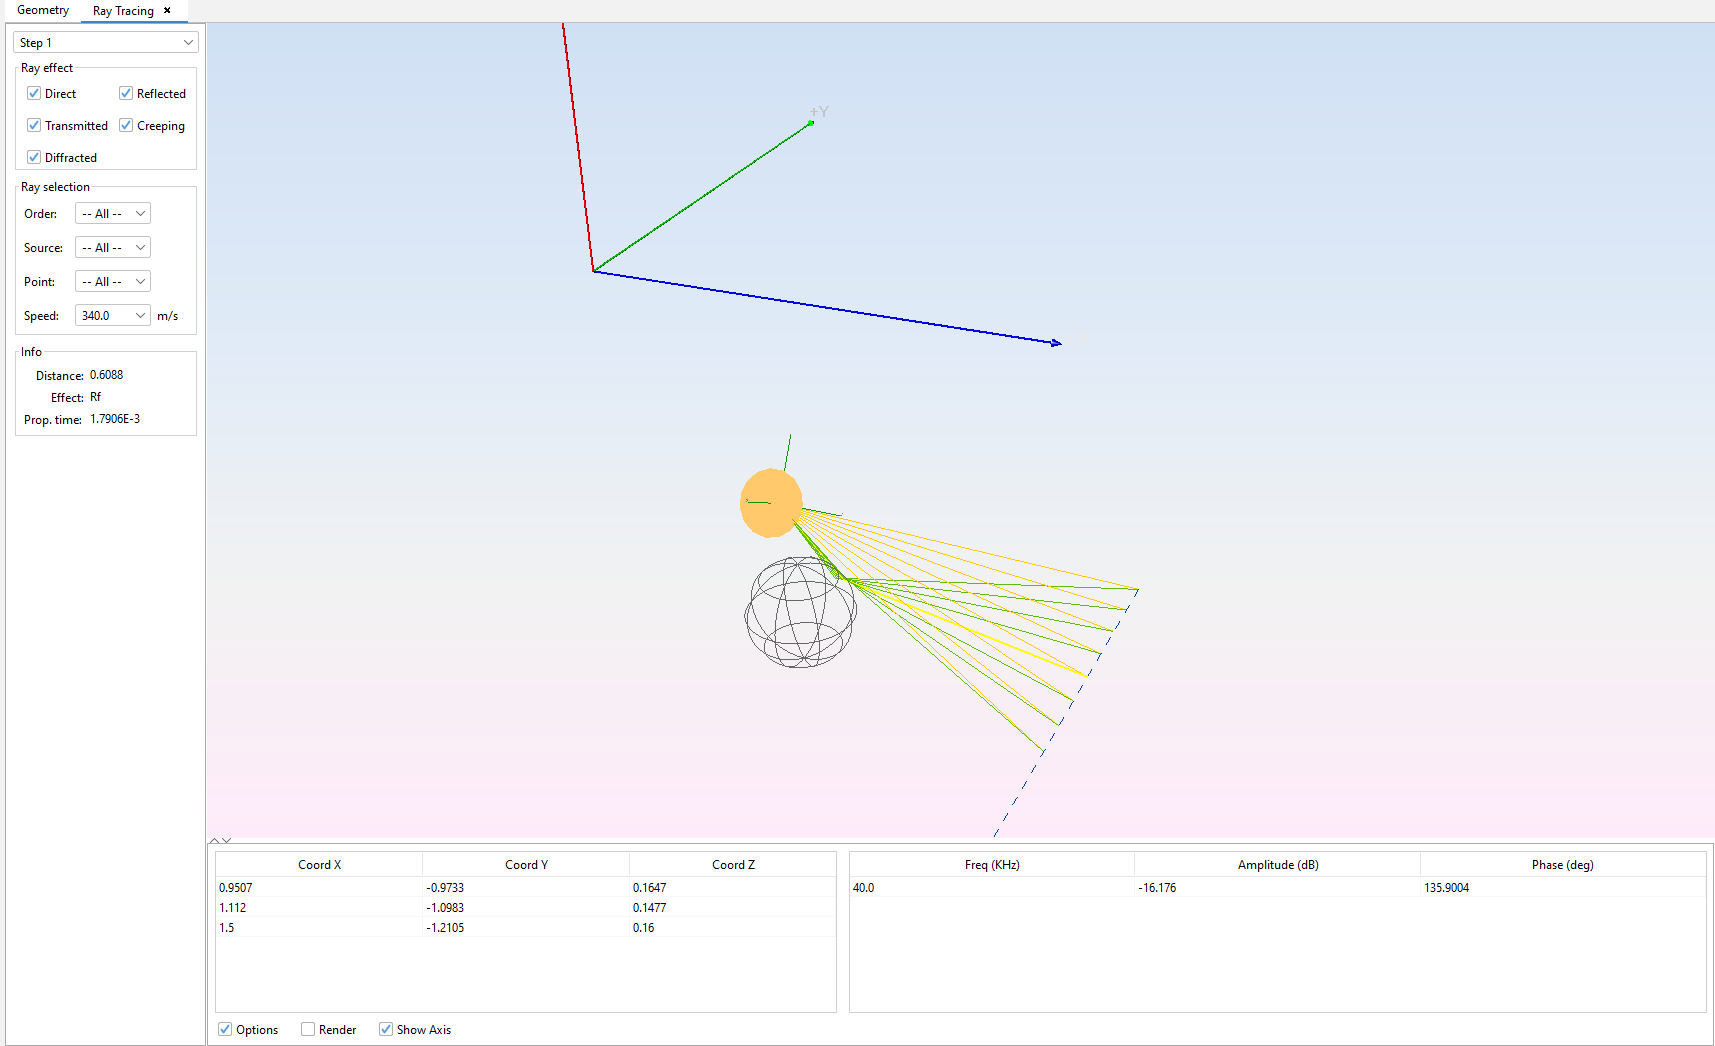
Selecting a ray will highlight it in yellow and its information will be shown in the Info panel (length of the ray, type of effect and propagation time). Other information will be shown in the bottom panel. This information comprises the frequency and its contribution to the total pressure at the corresponding observation point. The critical points of the ray are also displayed. These points consist on the starting point, the points where the ray bounces and the ending point (the observation point).
There are several visualization options at the bottom of the ray visualization panel:
- Options Controls whether the left (options) panel is shown.
- Render Controls whether the geometry in the geometry panel is fully rendered or shown as a wireframe model.
- Show Axis Controls whether the X, Y and Z axes are shown.