Plot Viewer
Values returned by user functions can also be plotted. To do that, the values must be previously computed in the Calculator tool.
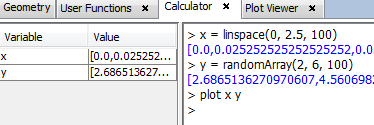
Click on Tools - Calculator menu. Invoke any user function that return an array of values, and the use the plot sentence to visualize the values in the Plot Viewer, as shown in next figure. Remember that an user function file with the considered functions is required for this example, as mentioned in the introduction section.
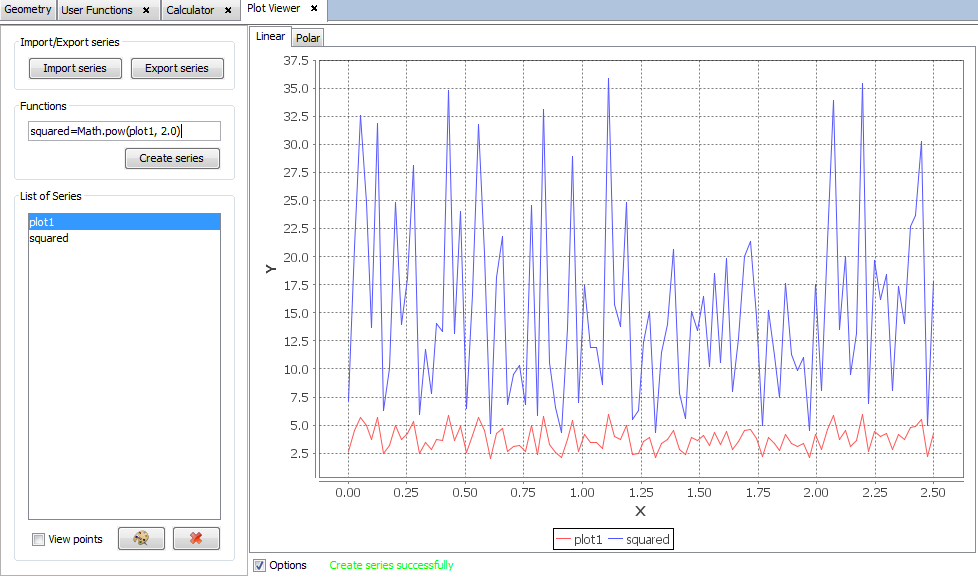
The plot sentence open the Plot Viewer with the selected data in a plotted serie (named plot1). Mathematical operations can be applied to the serie to obtain new plots, as shown in the below figure.