
Show Analysis Results
Analyze the results to minimize defects and prevent problems.
Results must be available in the Run History before viewing.
- On the ribbon, click the Molding tab.
-
On the Analysis icon, click Show Analysis
Results.

- In the Analysis Explorer, select a Run, Stage, and Result Type.
- Optional: Enable the various Show options to determine what is visible for the analysis.
- Optional: Enable the various Callouts options to show analysis results at a point of interest on your model. The callout values apply to the currently selected run.
- Optional:
Select the
 icon under Options to view the results as vectors
and change the size of the vectors.
Note:
icon under Options to view the results as vectors
and change the size of the vectors.
Note:- Not all result types can be presented as vectors.
- You can also activate and deactivate the vector visualization from
the
 menu under the Show heading.
- Optional:
Select the
 icon under Options to
show tensor plots at a selected node on the part.
Note:
icon under Options to
show tensor plots at a selected node on the part.
Note:- This option is available only when the molding part uses fibrous material.
- This option appears under Filling and Packing stages only.
- Optional:
Select the
 icon to show plots of
results data from the run's .csv
file.
icon to show plots of
results data from the run's .csv
file.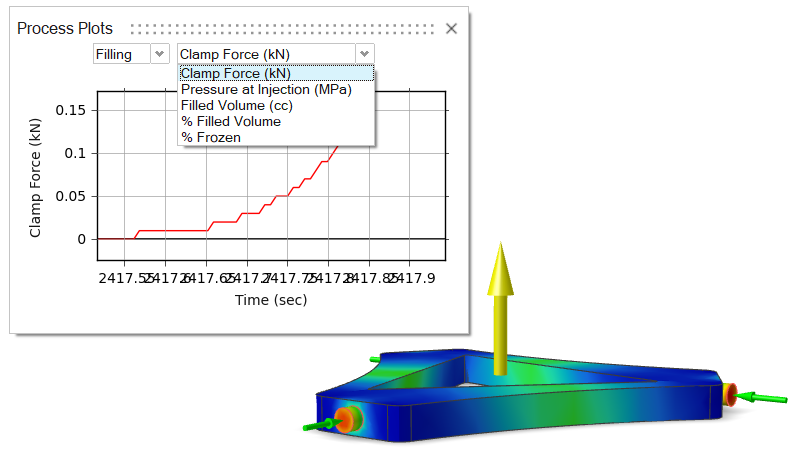
- Optional:
Click
 under Info to view
displacement results from a selected point of reference. Click on the model to
define the point of origin, then define the X and Y directions.
Note: This option is available in the Warpage stage only.
under Info to view
displacement results from a selected point of reference. Click on the model to
define the point of origin, then define the X and Y directions.
Note: This option is available in the Warpage stage only. - Optional:
Use the Uniform Compensation Percentage field to quickly
visualize how isotropically enlarging the mold will affect the finished
part.
Note: This option is available in the Compensated Displacement result only.
-
Analyze the run.
Tip: To see what areas on your model are under the greatest stress, select and drag the results slider. To restore the result slider's default values, click
 .
. 
Result Types
Results are available for cycling, filling, packing, cooling, and warpage analysis stages.
Cycling Results
| Option | Description |
|---|---|
| Temperature | View how the temperature changes during the cycling process. It will
take more time for the part to reach demolding temperature with each
cycle until the mold reaches working temperature.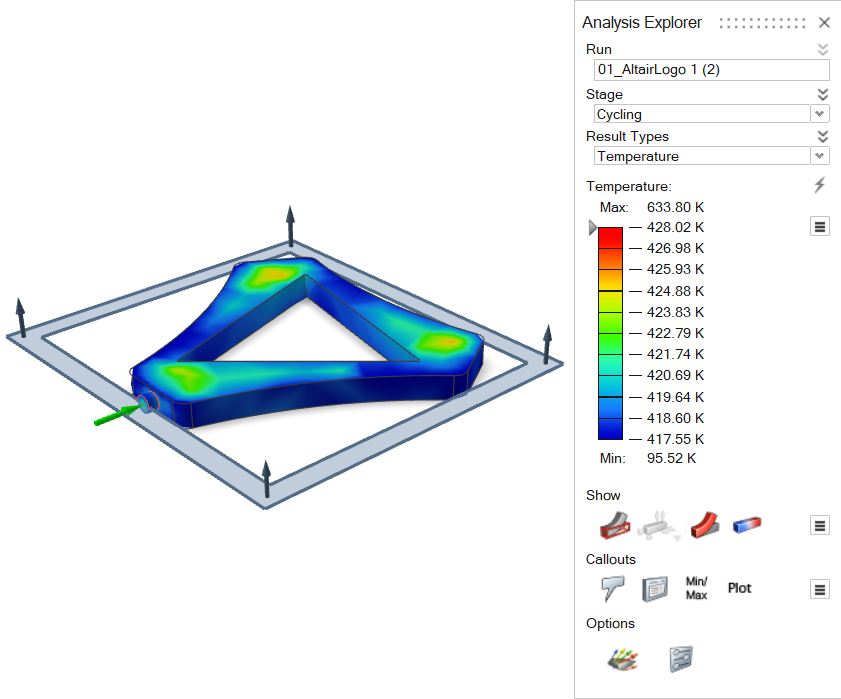 |
| Density | View how solidification time changes between cycles. The part will
take more time to solidify during each cycle until the mold reaches
working temperature.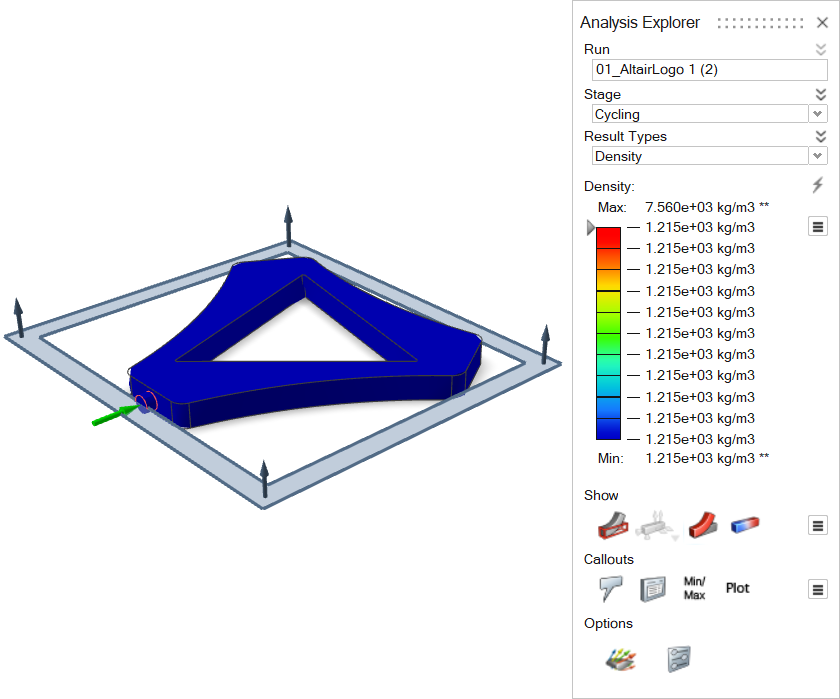 |
| Mold Temperature | See temperature changes in the mold during the cycling process. The
mold will absorb more heat with each cycle until it reaches working
temperature.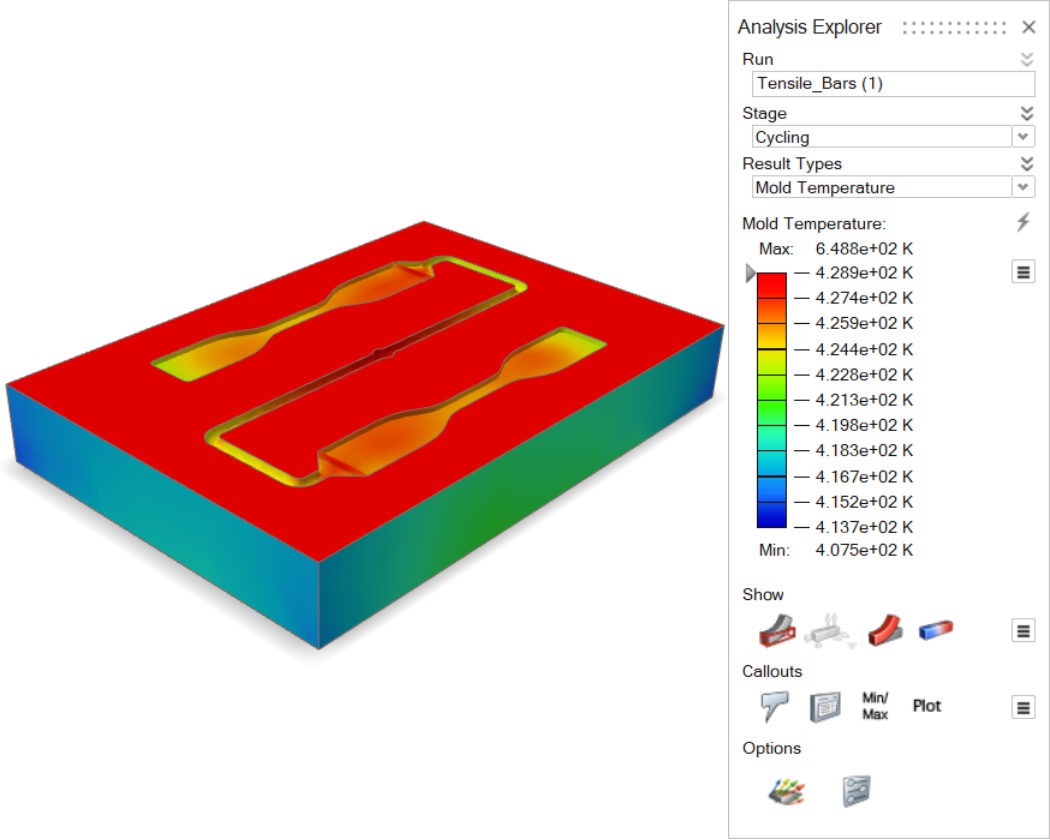 |
Filling Results
| Option | Description |
|---|---|
| Temperature |
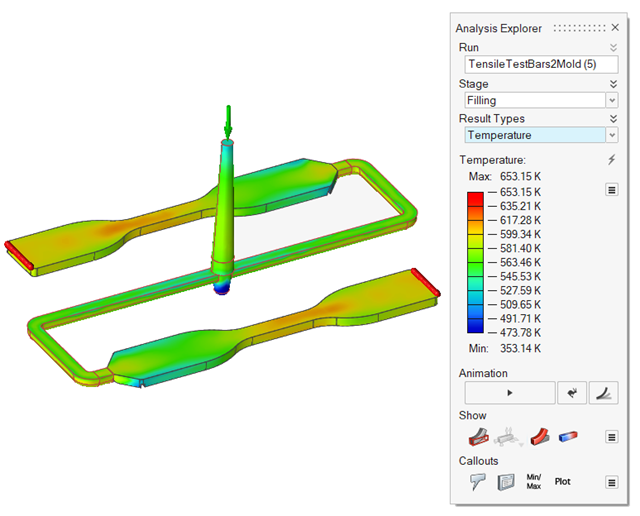 |
| Flow Front Temperature | Review the temperature at the time of filling.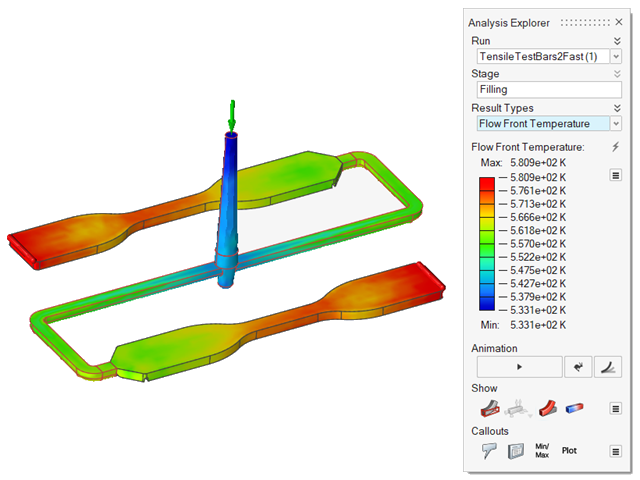 |
| Temperature (Core) | Review the temperature in the central region of the part during
filling.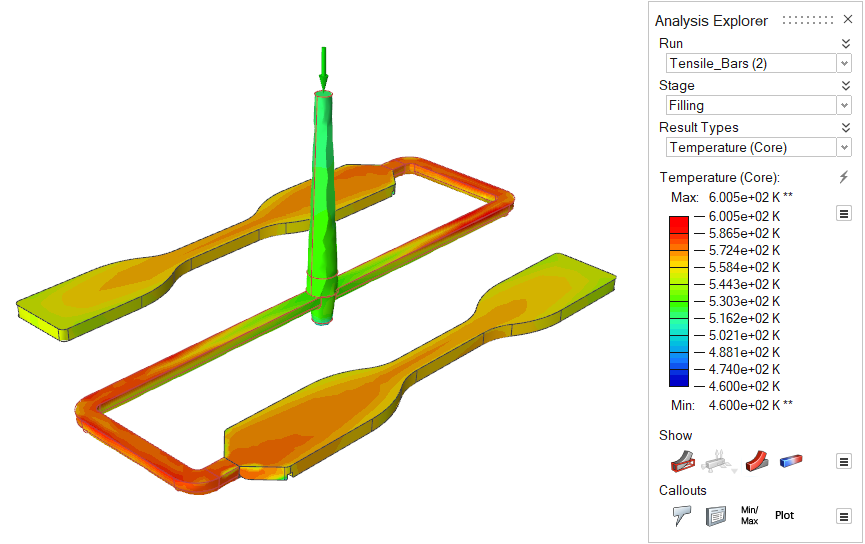 |
| Average Temperature | Review the average temperature across the thickness of the part
during filling.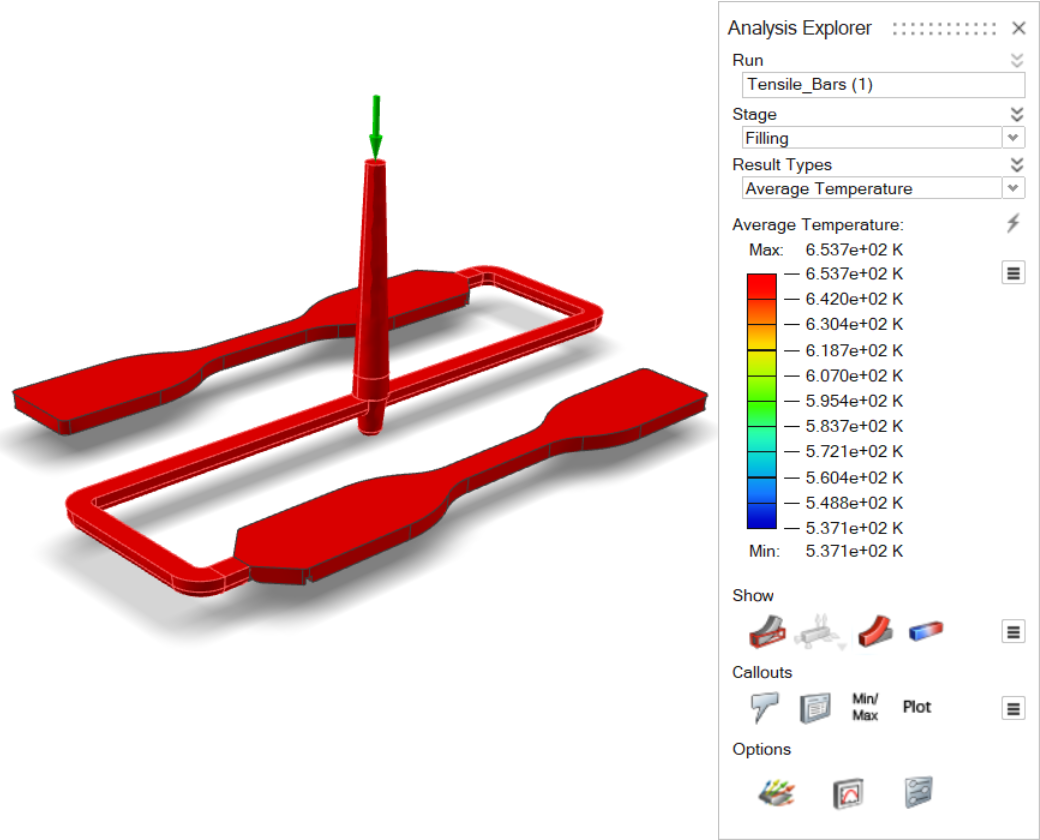 |
| Average Bulk Temperature | Shows on the surface the velocity-averaged temperature across the
thickness. Higher velocity regions have a larger contribution. 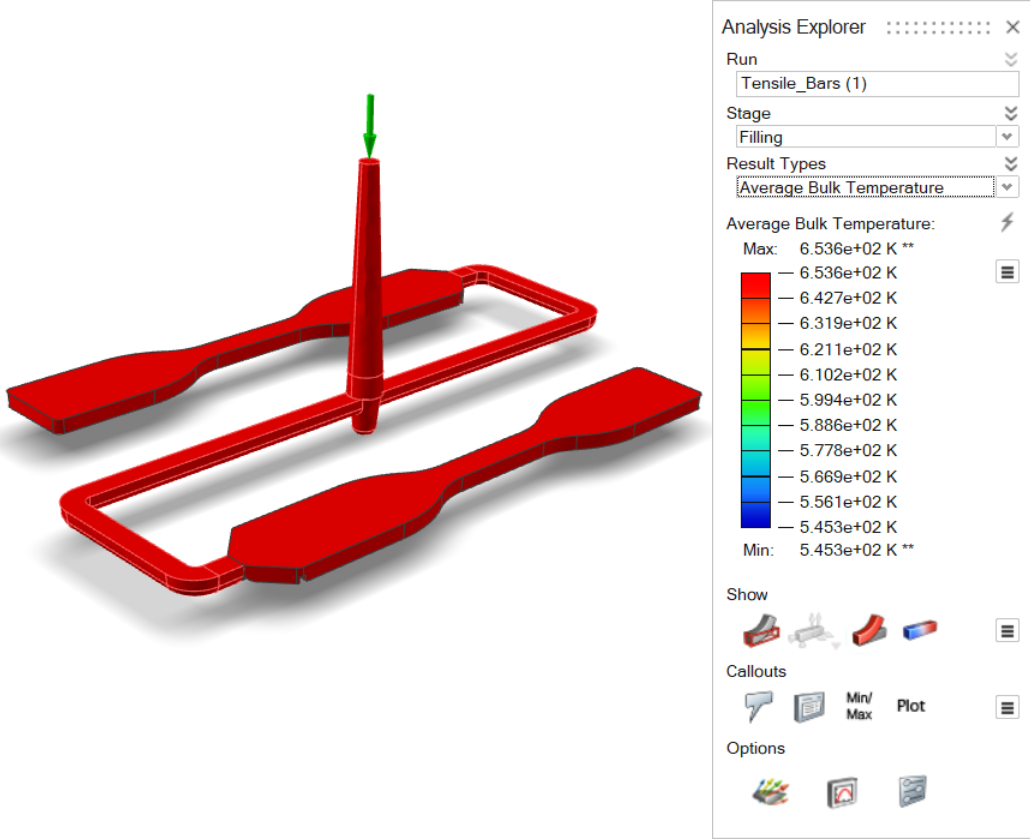 |
| Pressure | Review pressures inside the mold cavity produced during the filling
stage.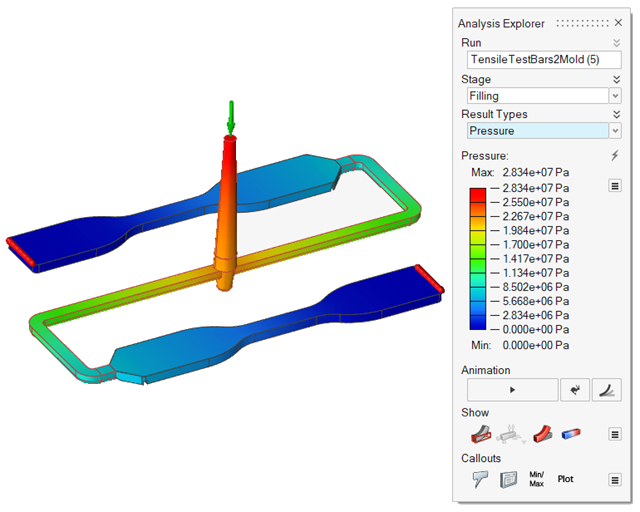 |
| Filling Time | Review the time it takes the material to reach different areas within
the part. The filling results can help you determine the best way to
fill the part and detect patterns that indicate the potential for
incomplete filling, unbalanced flow, weld lines and air pockets.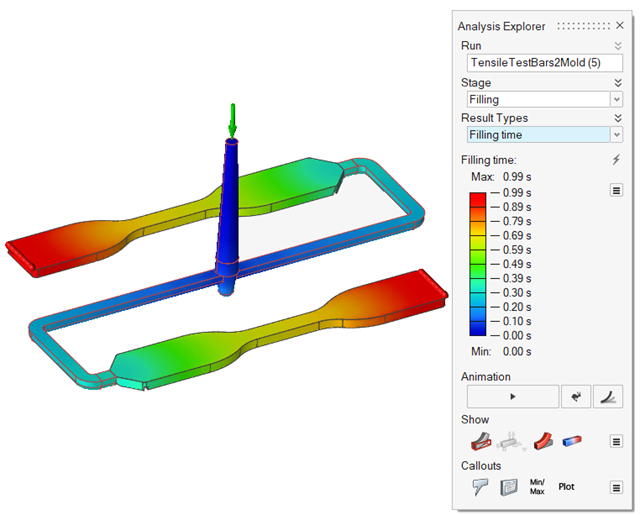 |
| Tracer ID | Review the amount of polymer entering the mold from each gate.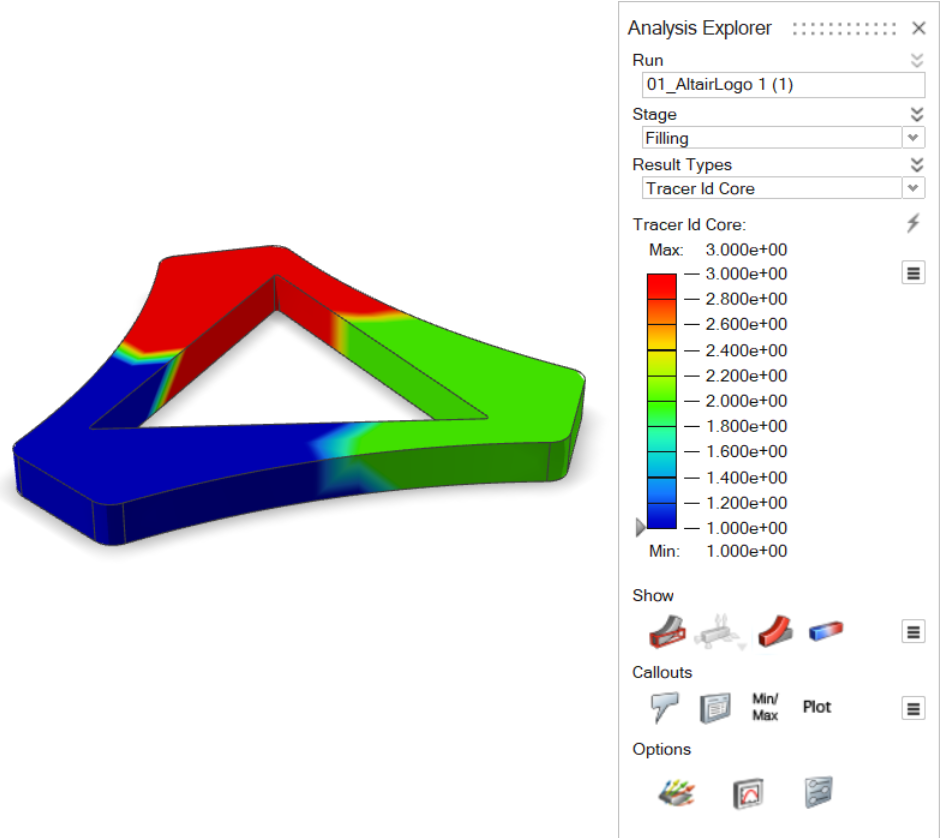 |
| Velocity |
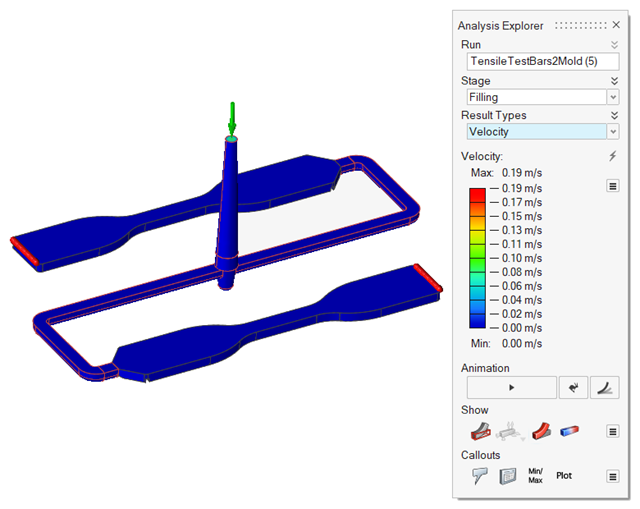 |
| Velocity Average | View the average velocity of the material through the part during
filling. 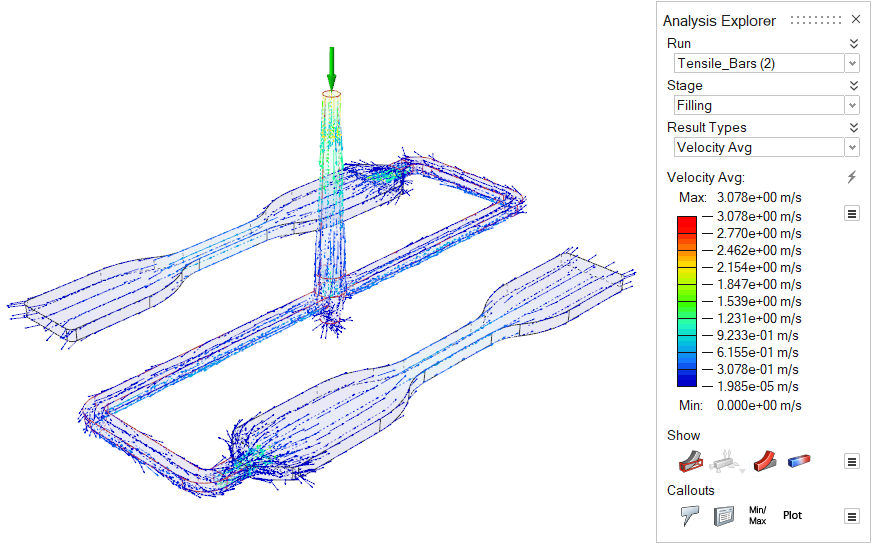 |
| Density | Review the polymer's density over time. Uniform density is ideal for
high quality results.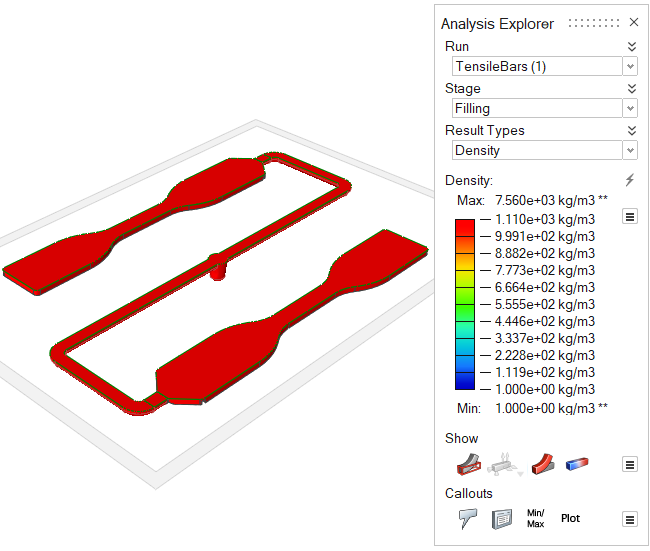 |
| Frozen Layer (%) | View the solidified and non-solidified regions of the part during filling.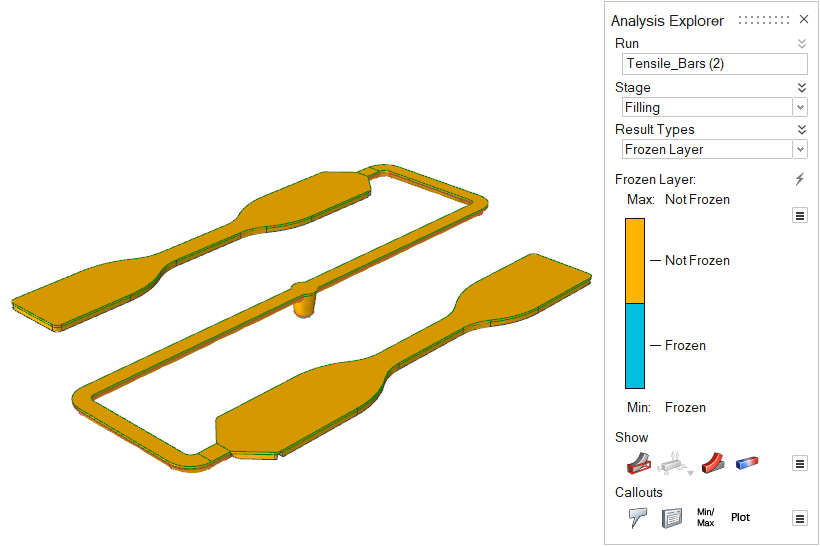 |
| Air Traps |
 |
| Weld Surface Angle | A weld surface is generated when two polymer flow fronts meet. This
can have an impact on both the appearance and strength of the part. The
weld surface angle is the angle at which the two fronts meet, defined as
0º for a weld in which the fronts meet from exactly opposite directions,
and increasing as the encounter is less direct. Weld surfaces above 135º
(less than 45º from parallel) are not shown. |
| Thickness | Review the thickness of different areas of the part. Local part
thickness affects local strain rates and heat flow. Abrupt changes in
thickness cause uneven cooling, which can lead to part shrinkage and
defects such as sink marks in the final part. This result can give
insight into the entire process.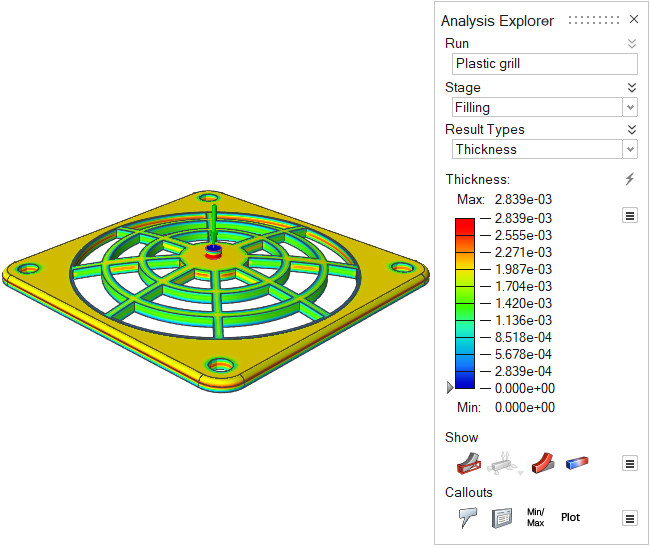 |
| Shear Rate | Review the maximum shear rate across the thickness of the part.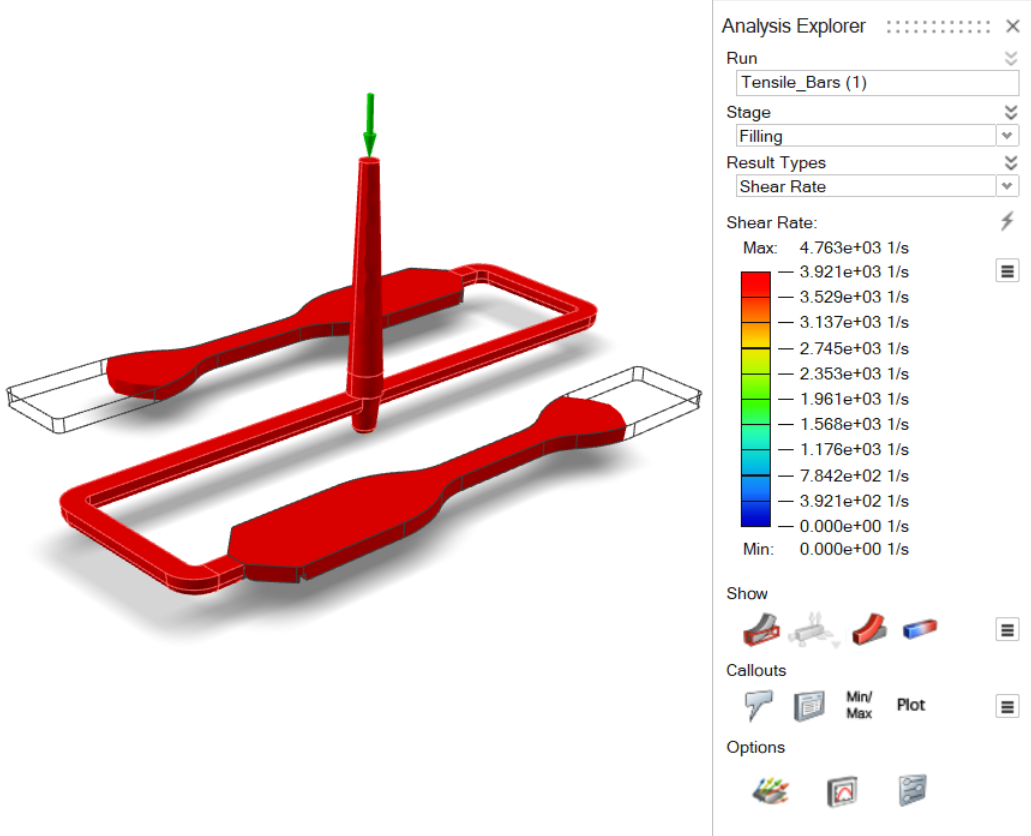 |
| Shear Stress | Review the maximum shear stress across the thickness of the
part.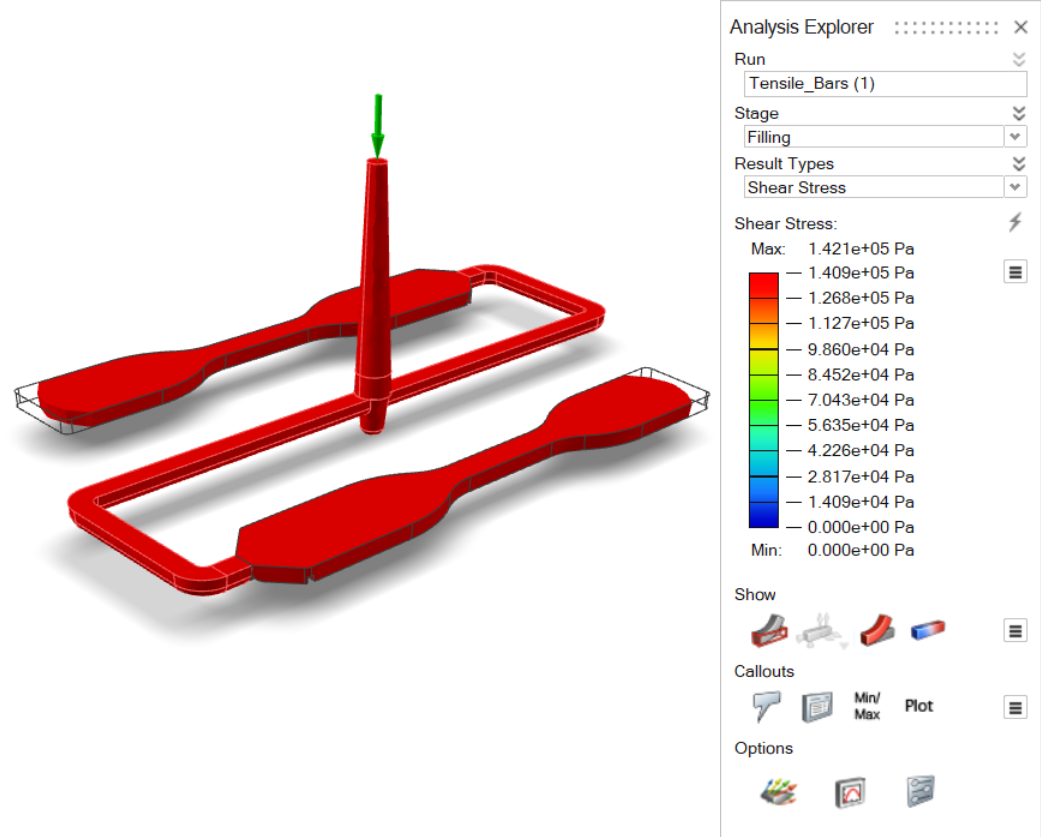 |
| Main Fiber Orientation |
This is the main fiber orientation component Displays the orientation and modulus of the first principal component of the fiber orientation tensor. A value close to 1 implies that most of the fibers are oriented in this direction. A value close to 1/3 implies no dominant orientation (random). 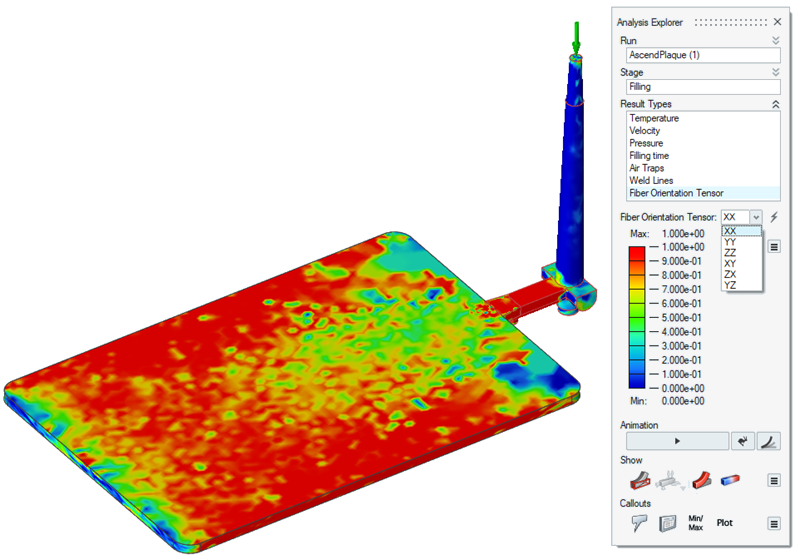 |
| Full Fiber Orientation | This result shows all the components of the Fiber Orientation
Tensor. |
| Mold Temperature | Review temperature variances in the mold.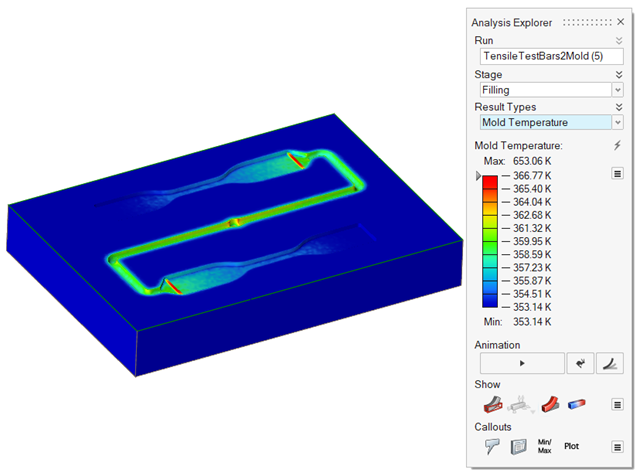 |
Packing Results
| Option | Description |
|---|---|
| Temperature | Review temperatures during the packing phase. The temperature will
decrease due to the temperature loss across the mold walls.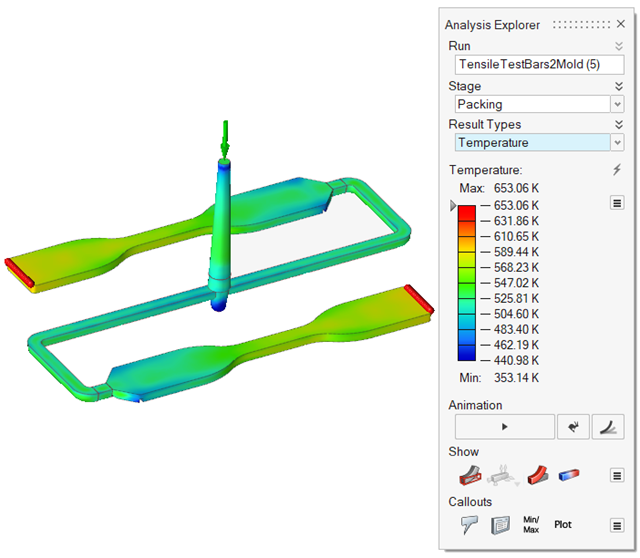 |
| Temperature (Core) | Review the temperature in the central region of the part during
packing.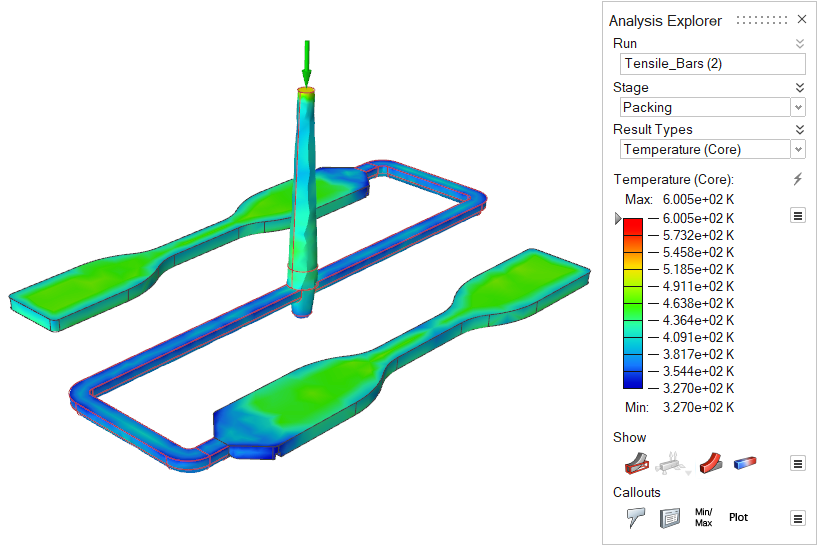 |
| Average Temperature | Review the average temperature across the thickness of the part
during packing.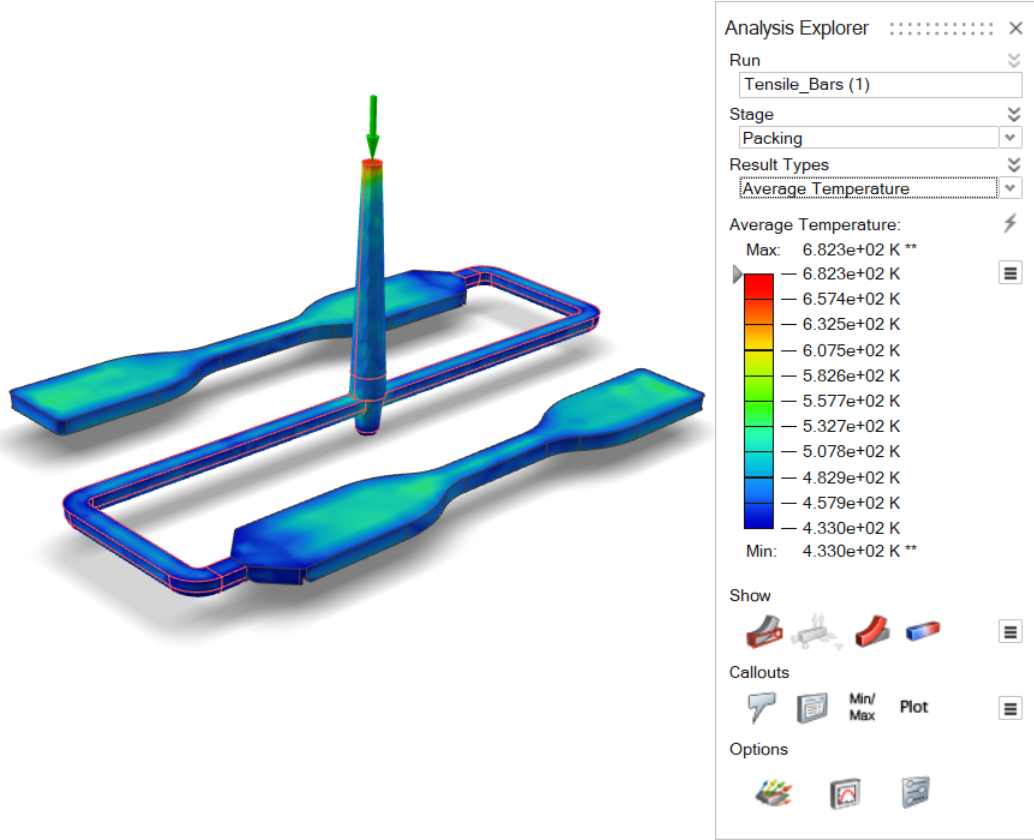 |
| Average Bulk Temperature | Shows on the surface the velocity-averaged temperature across the
thickness. Higher velocity regions have a larger contribution.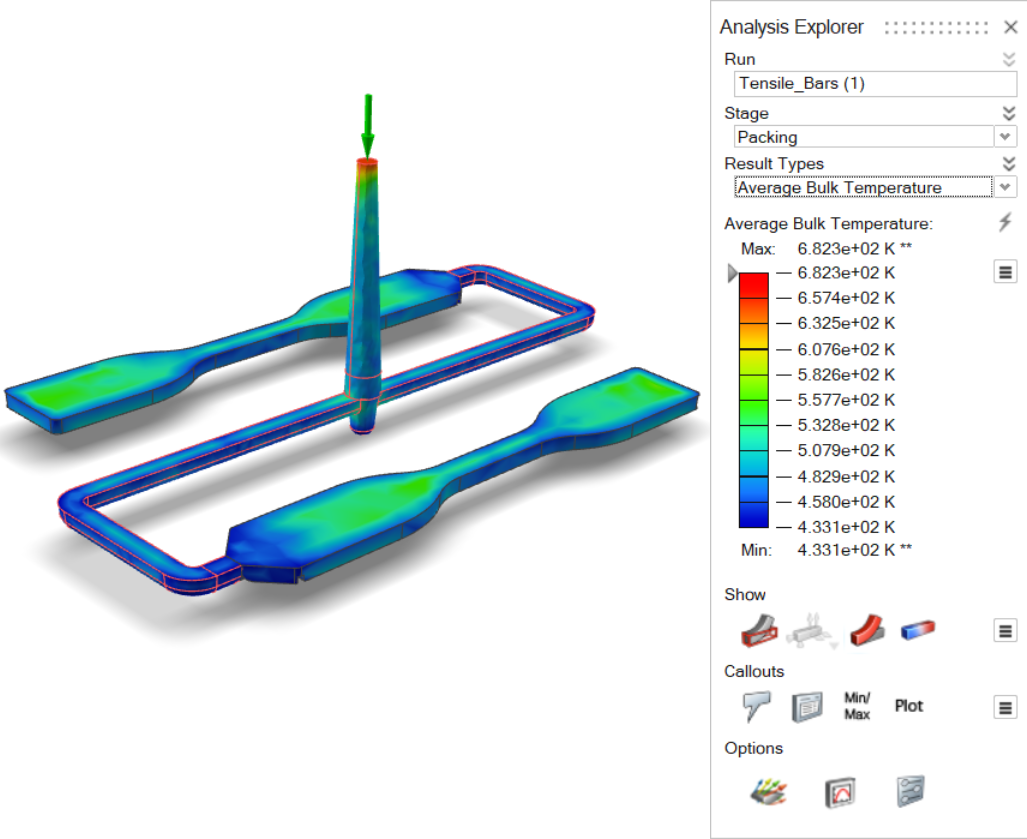 |
| Pressure | Consider pressures during the packing phase. These results are useful
to know points where the pressure is less than 0 to detect areas prone
to suffer a sink mark defect.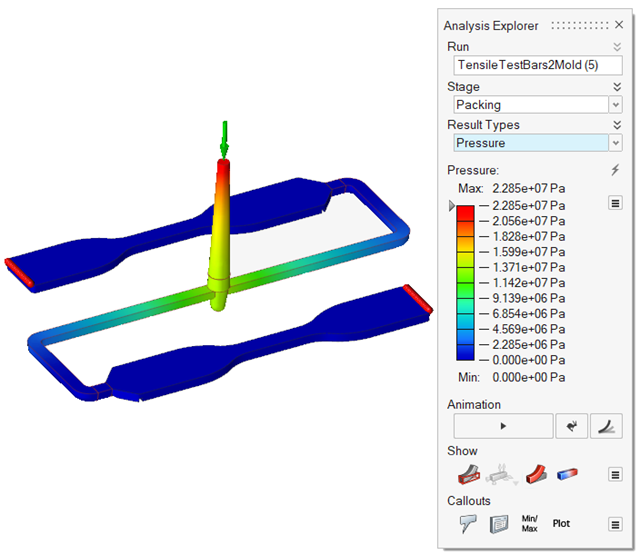 |
| Velocity | Examine velocity during the packing phase. Velocities will decrease
until the fluid stops flowing. |
| Velocity Average | View the average velocity of the material through the part during
packing.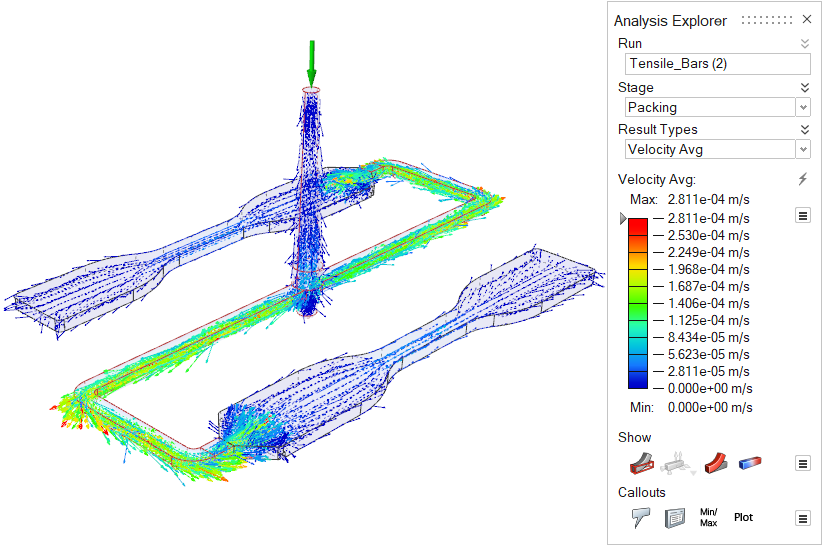 |
| Density | Review changes in the polymer's density over time. Uniform density is
ideal for high quality results. This result can help pinpoint the causes
of such defects as sink marks and shrinkage.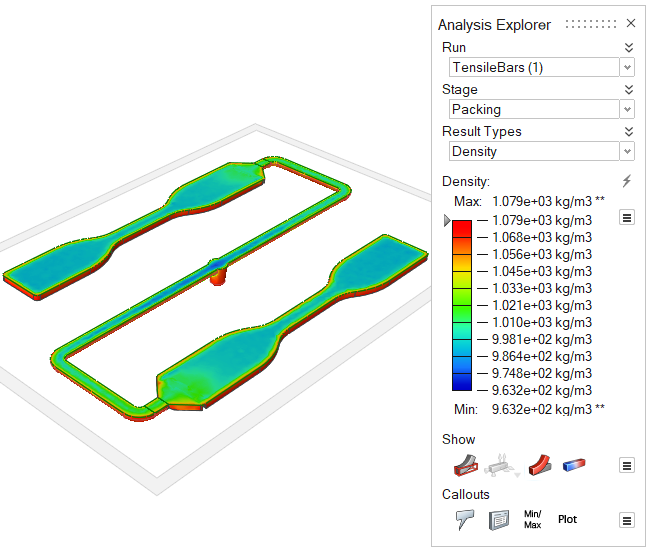 |
| Frozen Layer (%) | View the solidified and non-solidified regions of the part during
packing.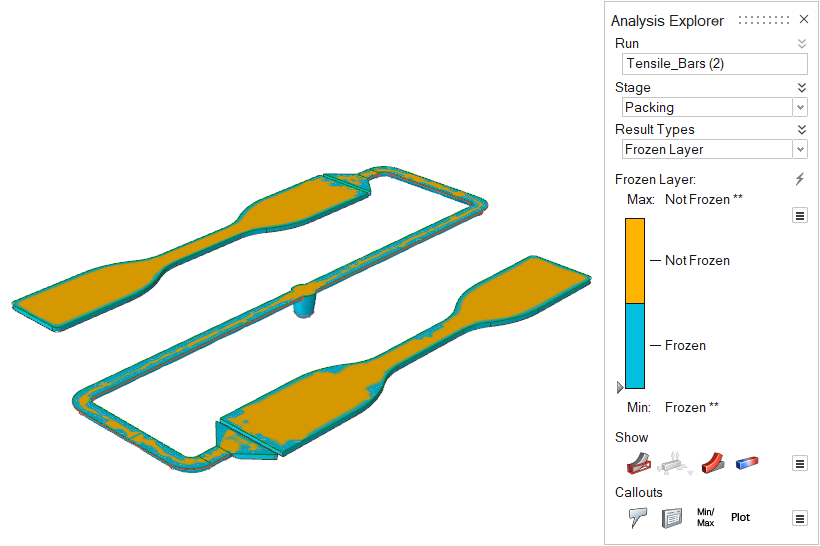 |
| Thickness | Review the thickness of different areas of the part. Local part
thickness affects local strain rates and heat flow. Abrupt changes in
thickness cause uneven cooling, which can lead to part shrinkage and
defects such as sink marks in the final part. This result can give
insight into the entire process.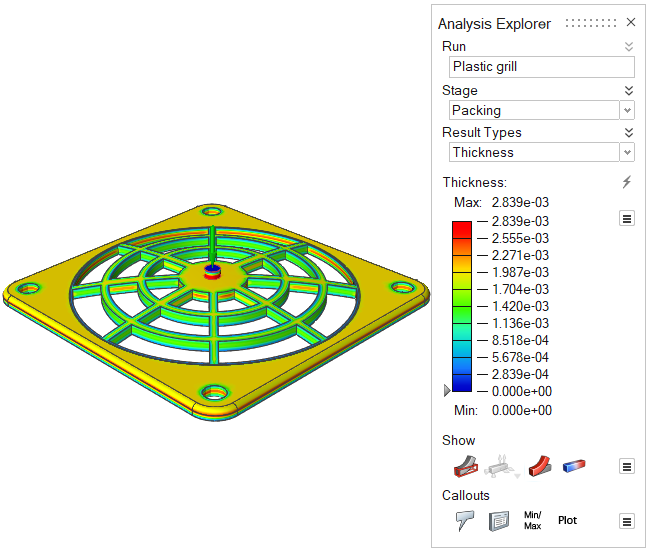 |
| Shear Rate | Review the maximum shear rate across the thickness of the part.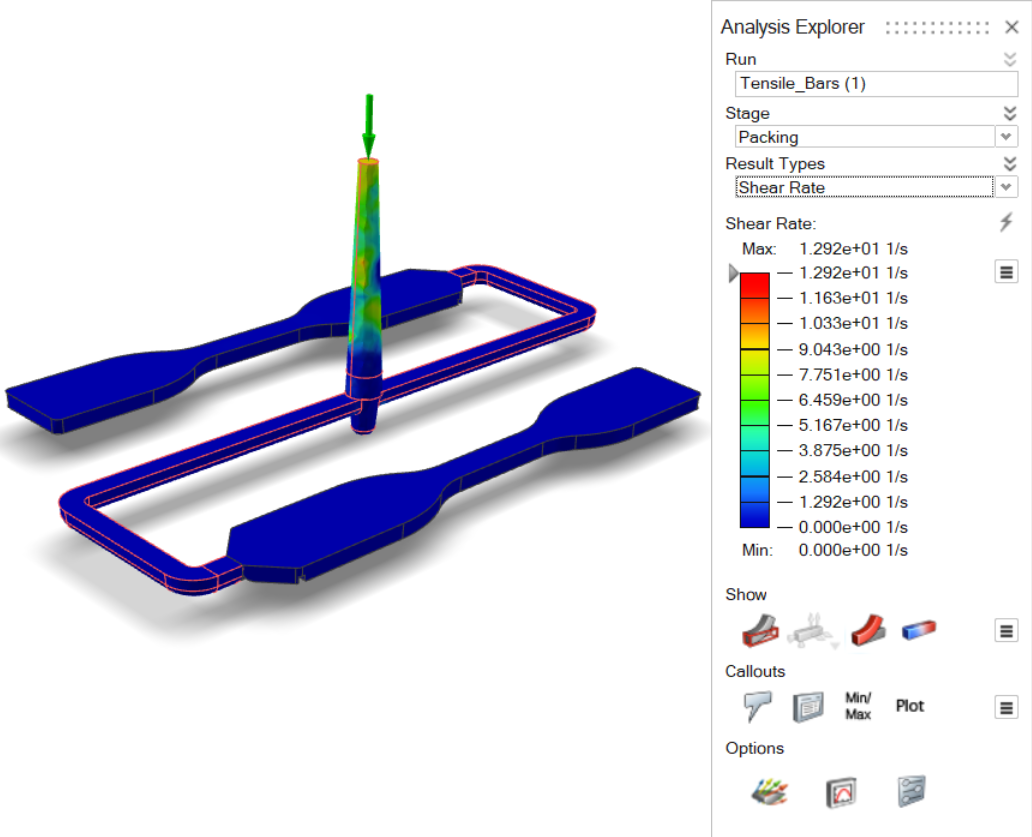 |
| Shear Stress | Review the maximum shear stress across the thickness of the
part.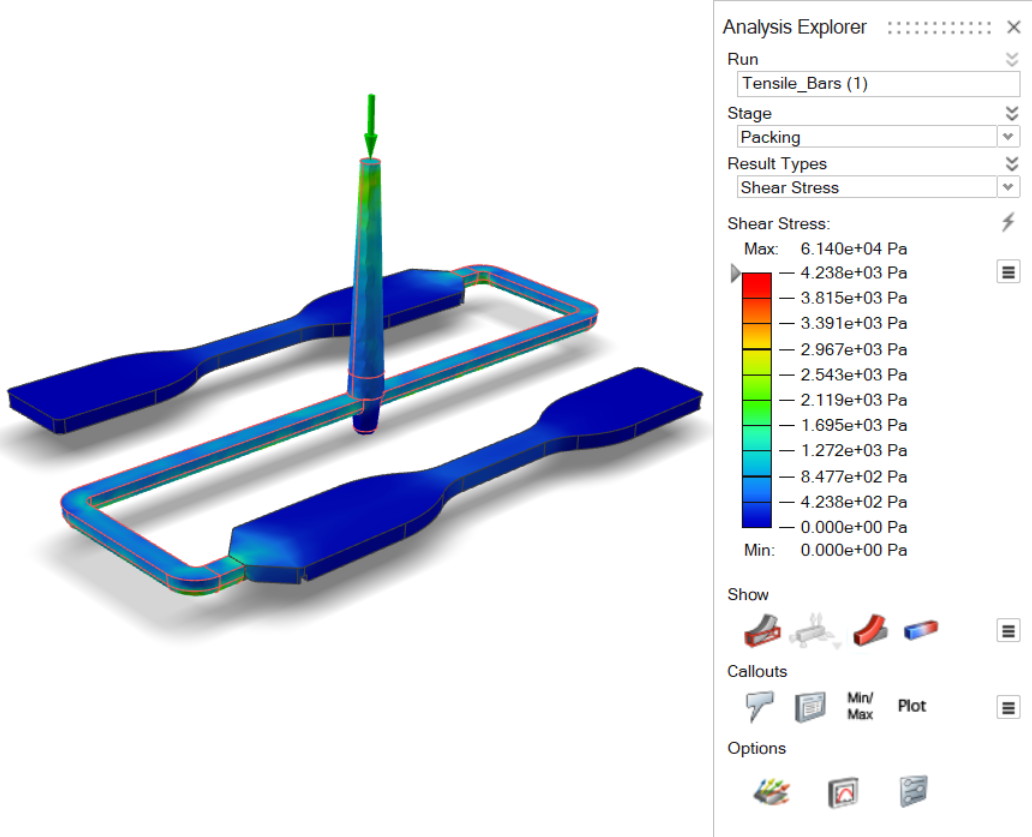 |
| Volumetric Shrinkage | This result shows the local shrinkage (you can see the differences
across the thickness) in the finished part. |
| Average Volumetric Shrinkage | This result shows the average shrinkage across thickness in the
finished part. |
| Sink Marks | Detect surface depressions, usually in the thicker sections of the
model, caused by shrinkage during the packing stage.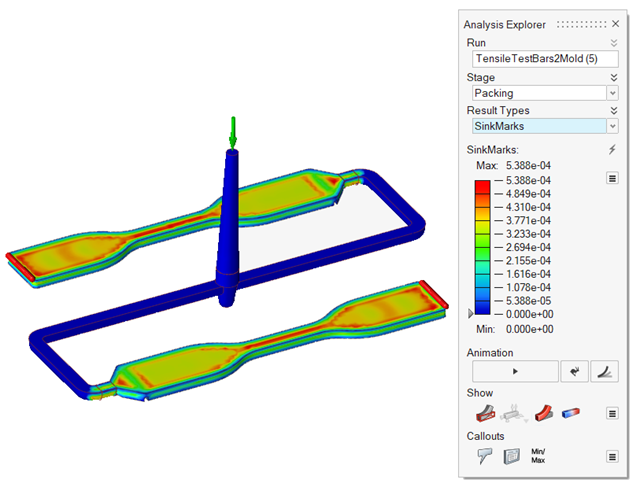 |
| Main Fiber Orientation |
This is the main fiber orientation component Displays the orientation and modulus of the first principal component of the fiber orientation tensor. A value close to 1 implies that most of the fibers are oriented in this direction. A value close to 1/3 implies no dominant orientation (random).  |
| Full Fiber Orientation | This result shows all the components of the Fiber Orientation
Tensor. |
| Mold Temperature | Review temperature variances in the mold.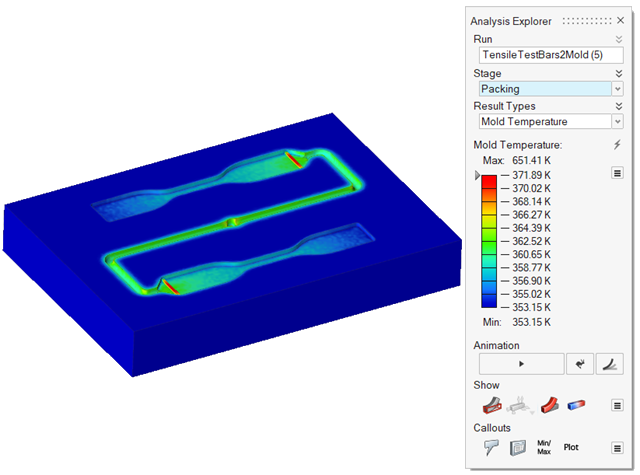 |
Cooling Results
| Option | Description |
|---|---|
| Temperature | Examine the temperature evolution once the mold is totally filled.
You can determine the final temperature at which to stop the cooling
phase.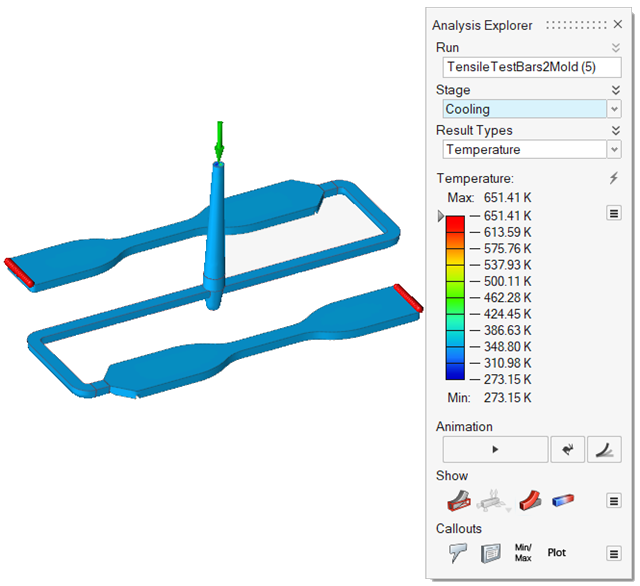 |
| Temperature (Core) | Review the temperature in the central region of the part during
cooling.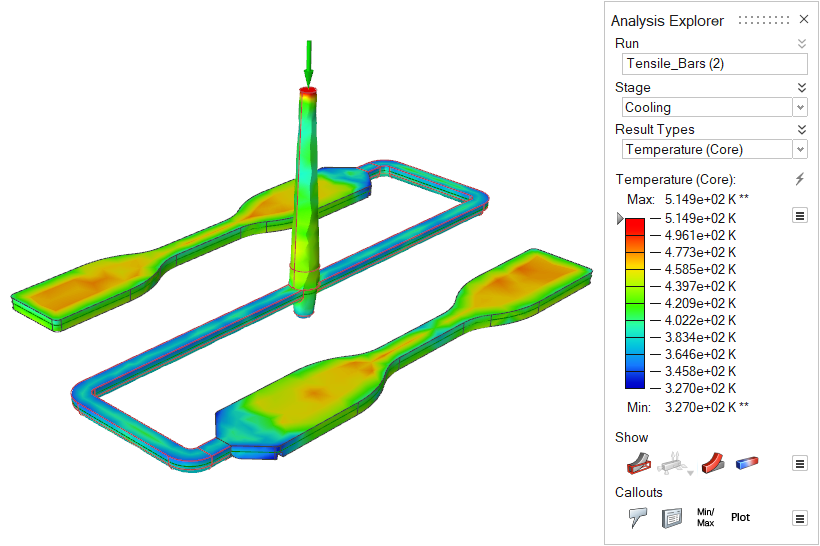 |
| Average Temperature | Review the average temperature across the thickness of the part
during cooling.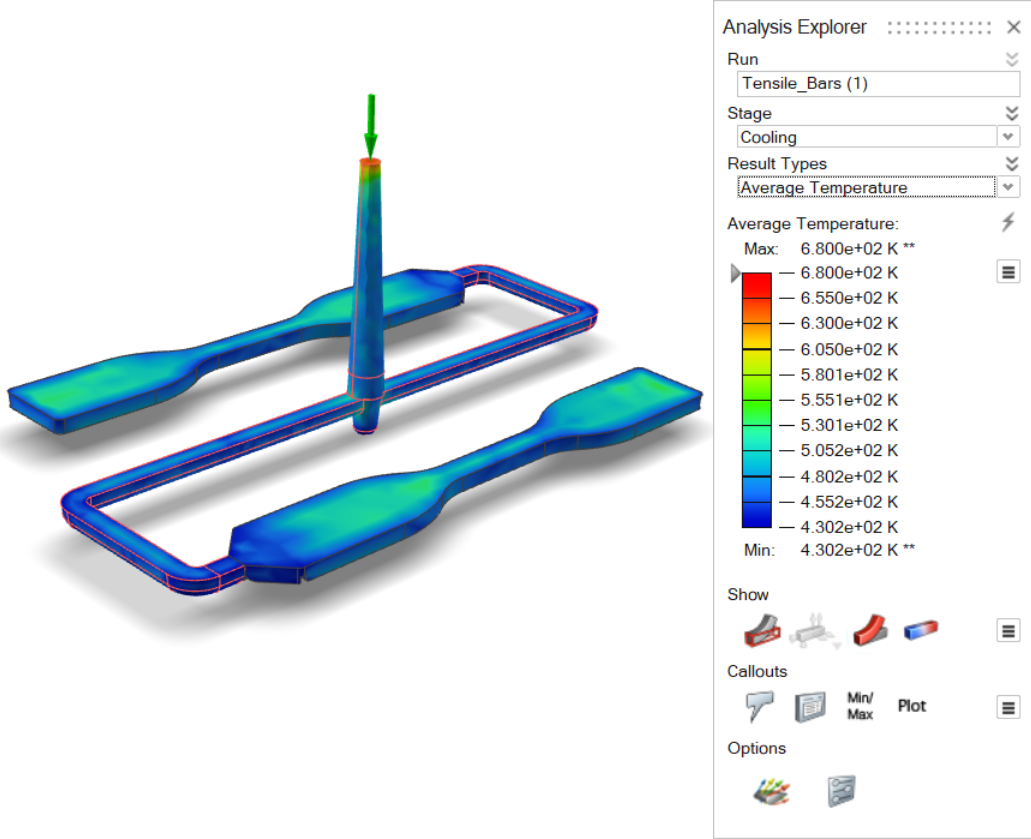 |
| Density | Review changes in the polymer's density over time. Uniform density is
ideal for high quality results. This result can help pinpoint the causes
of such defects as sink marks and shrinkage. 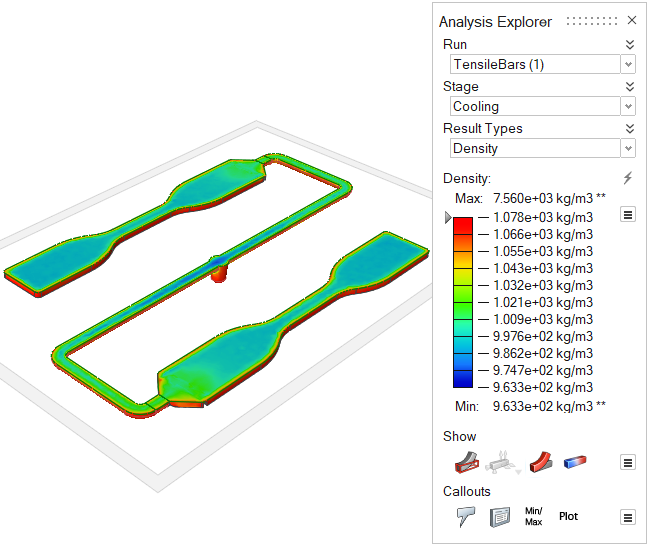 |
| Frozen Layer (%) | View the solidified and non-solidified regions of the part during
cooling.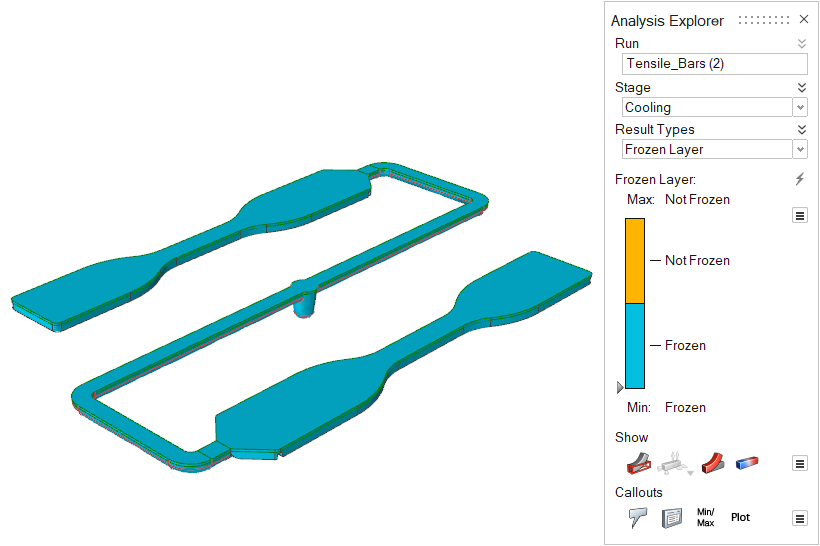 |
| Thickness | Review the thickness of different areas of the part. Local part
thickness affects local strain rates and heat flow. Abrupt changes in
thickness cause uneven cooling, which can lead to part shrinkage and
defects such as sink marks in the final part. This result can give
insight into the entire process.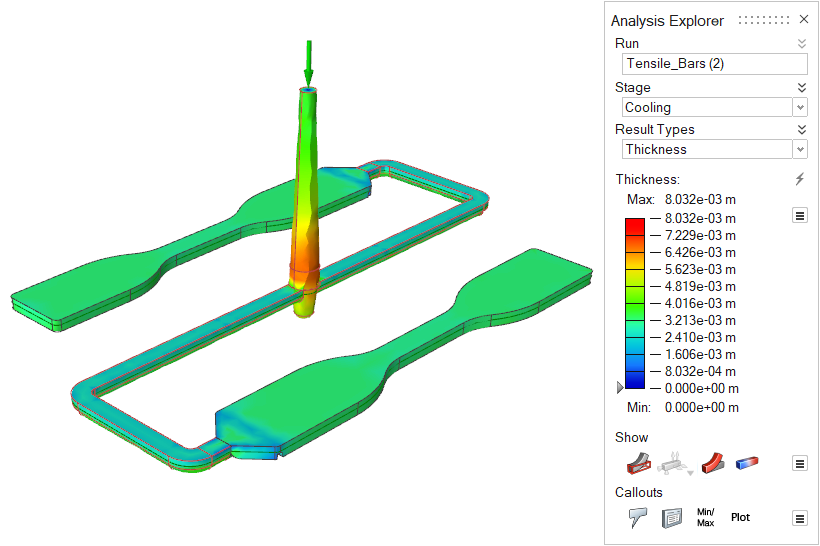 |
| Mold Temperature | Review temperature variances in the mold.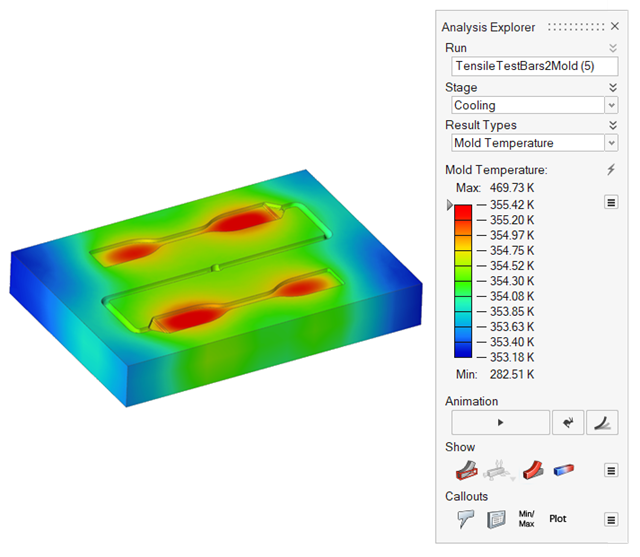 |
Warpage Results
| Option | Description |
|---|---|
| Displacement | Detect folding, bending, twisting or bowing in the molded part, which
is usually due to non-uniform cooling. The displacement contour displays
how the part is warping so that you can make the appropriate corrective
measures to the cooling rate, cooling channel design, or process
data.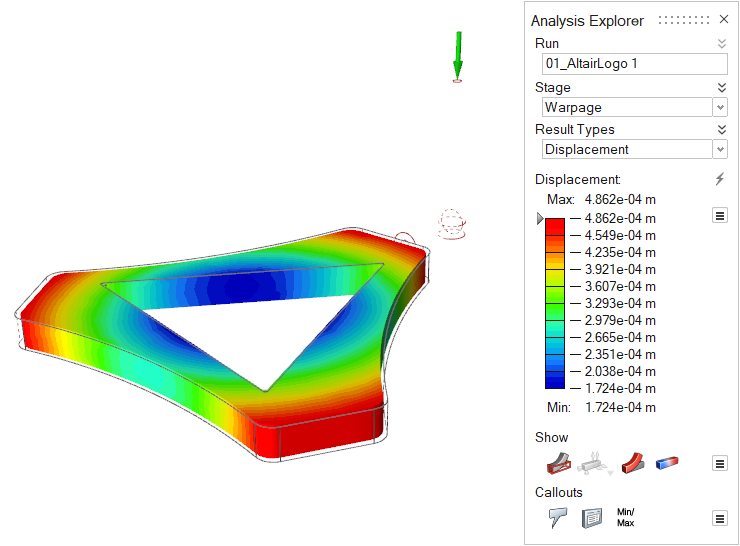 |
| Compensated Displacement |
Use the Uniform Compensation field to quickly visualize how isotropically enlarging the mold cavity will affect the finished part. If large warpage displacements beyond the compensated contraction appear, either process parameter changes or more complex mold cavity modifications--or possibly both--are needed. 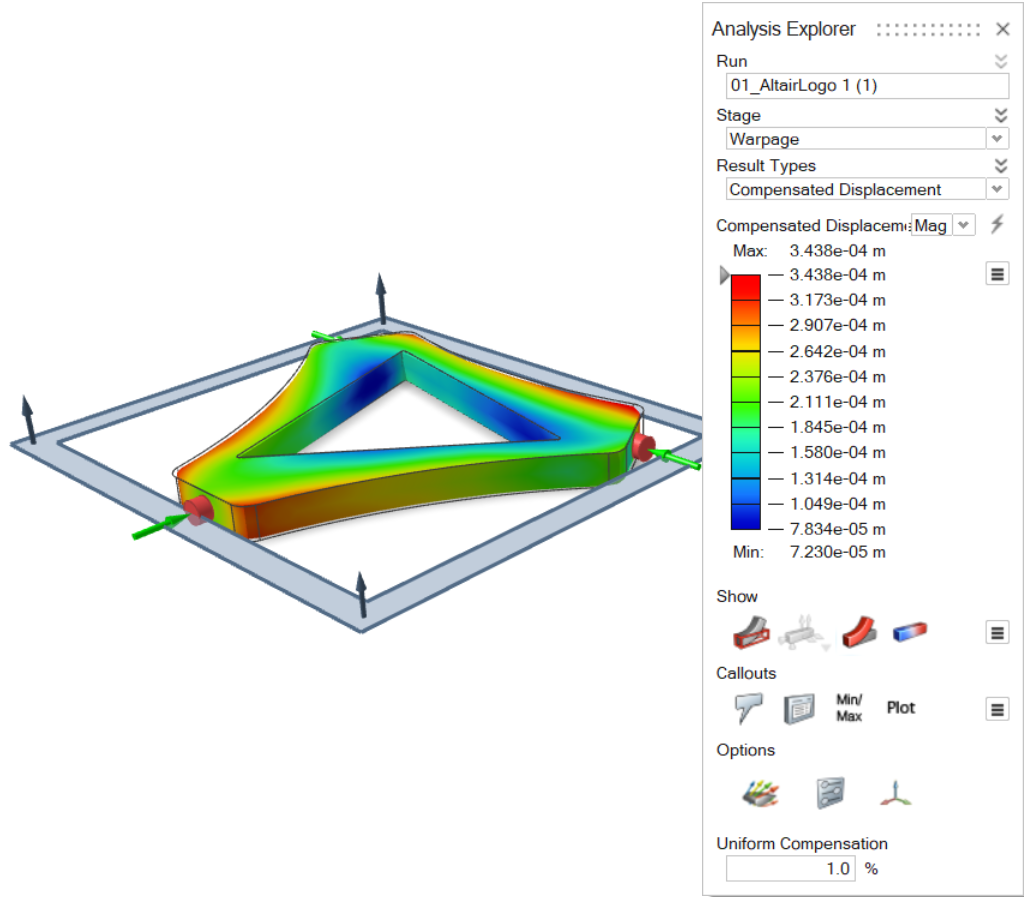 |
View Molding Defects
Fix issues with air traps, weld surfaces, and sink marks.
-
When the run is complete, click the Show Analysis
Results
icon or double-click the run the in Run
Status window to view the results.
-
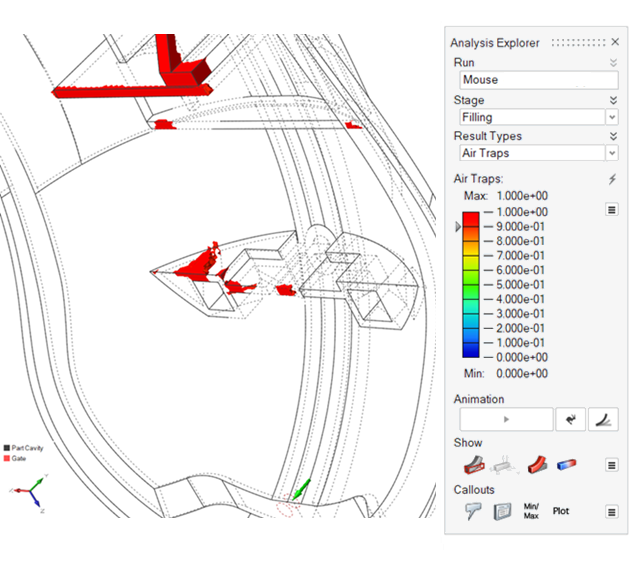
In the Analysis Explorer select the
Filling stage, then view the results for
Air Traps. This defect occurs when there is not
enough venting, and air gets trapped in the mold.
Note: To fix issues with air traps:- Optimize your design to create appropriate gating.
- Select low viscous materials, which will allow more air to be released.
- Add proper ventilation.
- Align your mold properly to help provide ventilation for trapped air.
-
Next, view Weld Surfaces for the Filling stage. This
simulation shows the regions where two flow fronts meet. This defect can occur
in parts with a core or insert. If the two fronts that meet have different
temperatures, they may not meld completely in the mold because of a temperature
gradient.
Note: To fix issues with weld surfaces:- Select a material with a low melting temperature.
- Increase the injection temperature and speed.
- Modify the design to obtain a single flow.
- Increase the melting temperature of the material.
-
View Sink Mark results for the Packing stage. These
defects occur in the thicker sections of the model when the cooling rate and
compensation are not sufficient. Rib sections and internal fillets are the most
common areas to be affected.
Note: To fix issues with sink marks:- Redesign the thickest section where sink mark is occurring and try to reduce the thickness.
- During Packing, lower the mold temperature using the Cooling System.
- Increase the gate size to allow enough material to fill and pack the mold.
- Increase the holding temperature during the Packing cycle.
Callouts
Create, show, hide, and list callouts for selected result types at points of interest on your model.
After running an analysis, click the Show Analysis Results on the Analyze icon. Options for callouts appear in the Callouts section of the Analysis Explorer.
| Callout Icon | Description | Note |
|---|---|---|
| Create, Show, and Hide Callouts |
Click the |
After creating callouts, click the |
| List Callouts |
Display a list of all callouts in a table. Each callout is specific to the selected run. | Click the |
| Min/Max Callouts |
Create a callout showing where the minimum/maximum value occurs for the selected result type. | Click the min/max callout in the modeling window to create a regular callout at the same location. |
| Options |
Dynamic Callouts: Make callouts dynamic, so they display the value of the currently selected result type. | If you enable the Compare Results feature in a callout, the callout becomes static. |