
Quick Molding Analysis
Run a quick injection molding analysis to get initial data on the practicality of your model setup.
Run Quick Analysis
Define run options and execute a quick analysis to understand predicted flow pattern and sink marks data during molding.
Complete the model setup before running an analysis.
Note: Analysis results are saved
in the folder specified in your Preferences settings under Molding >
Analysis > Run Options.
-
Click Run Quick Analysis on the Quick icon.

-
Define the parameters for the analysis.
Tab Option Description 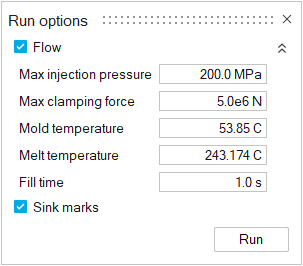
Flow Enable this option to run a flow pattern analysis. Max injection pressure Enter the maximum pressure that your injection machine can produce. Max clamping force Enter the maximum force required to keep the mold closed during the injection process. Mold temperature Enter the initial temperature of the mold.Note: This field can be filled via the Molding Window.Melt temperature Enter the melt temperature of the material. Note: This field can be filled via the Molding Window.Fill time Enter the time it will take to fill the mold. Note: This field can be filled via the Molding Window.Sink marks Enable this option to run a sink marks analysis.
-
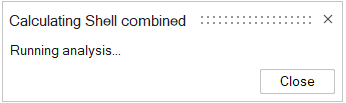
Click Run.
The run status is displayed.
 Note: A Quick analysis calculates shell results only. For results that include an analysis of the interior volume of the molded part, you must run an advanced analysis.
View Quick Analysis Results
Review data from a quick analysis.
You must first run a Quick Analysis.
- In the Analysis Explorer, select a Run, Stage, and Result Type.
- Optional:
Select the
 icon to show plots of
results data from the run's .csv file.
icon to show plots of
results data from the run's .csv file.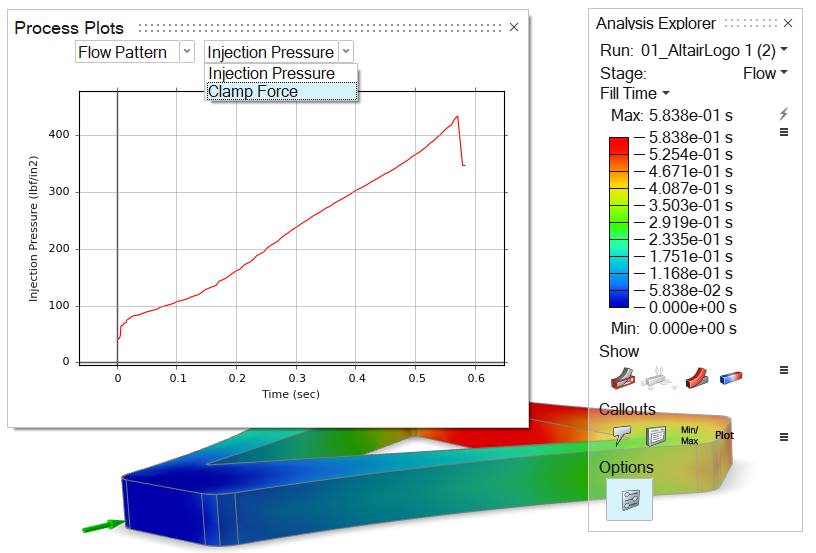
Note:- Process plots are available only in the Flow stage.
- Clamp force can be expressed in foot-pounds and injection pressure can be expressed in PSI. To change the units shown, use the unit selector at the bottom right corner of the modeling window.
Quick Result Types
Quick analysis results include flow and sink mark data, and measure only the shell mesh. For results that include the interior of the part, run an advanced analysis.
Flow Results
| Option | Description |
|---|---|
| Fill Time | Review the time it takes the material to reach different
areas within the part. The filling results can help you
determine the best way to fill the part and detect patterns that
indicate the potential for incomplete filling, unbalanced flow,
weld lines and air pockets.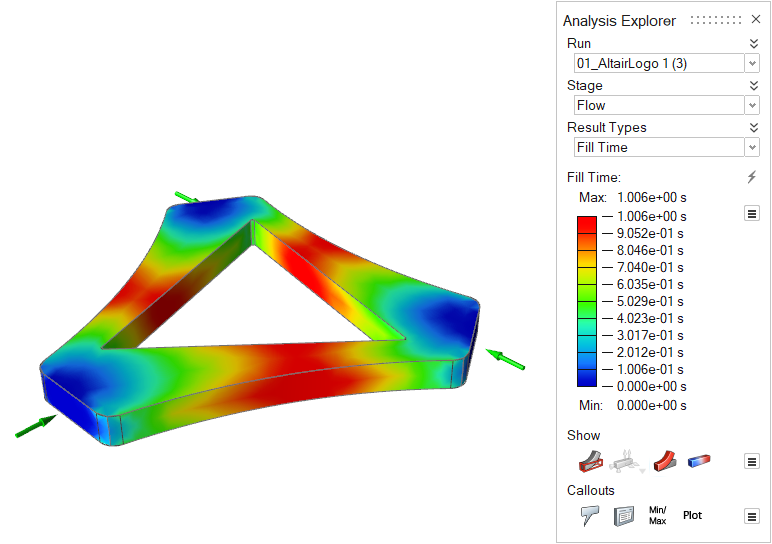 |
| Confidence of Fill | Review areas of the part cavity that may not be completely
filled with material. Green areas are safe. Yellow and orange
areas are increasingly risky. Red areas will not be filled under
the current settings. 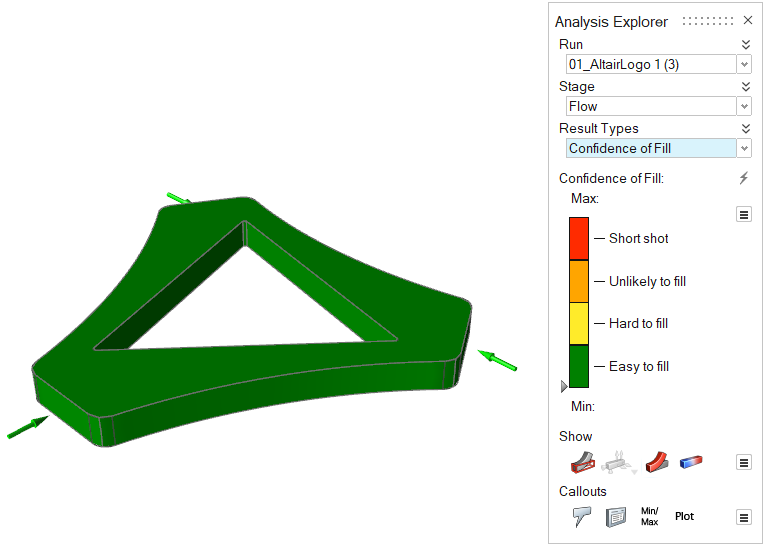 Note: Available in only in a quick analysis. |
| Front Temperature | Review the temperature at the time of filling.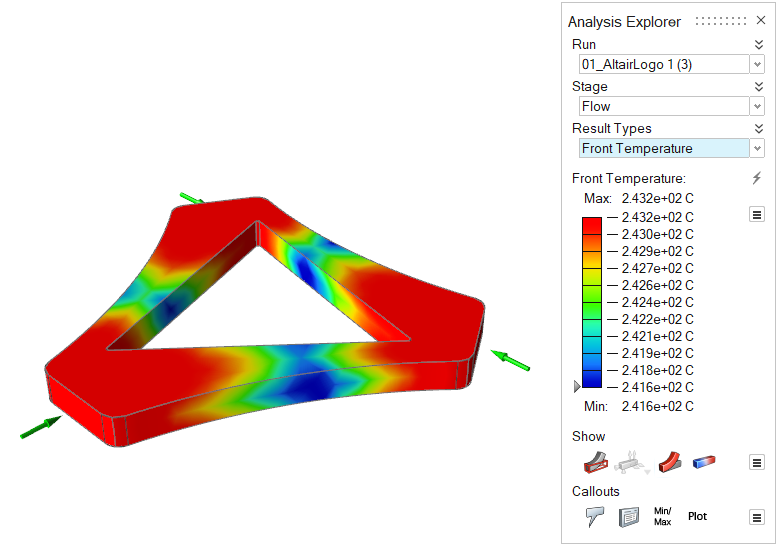 |
| Pressure Drop | Review the pressure required for the material to reach
different regions of the part cavity during filling. Pressure
Drop is usually greater farther from the inlets.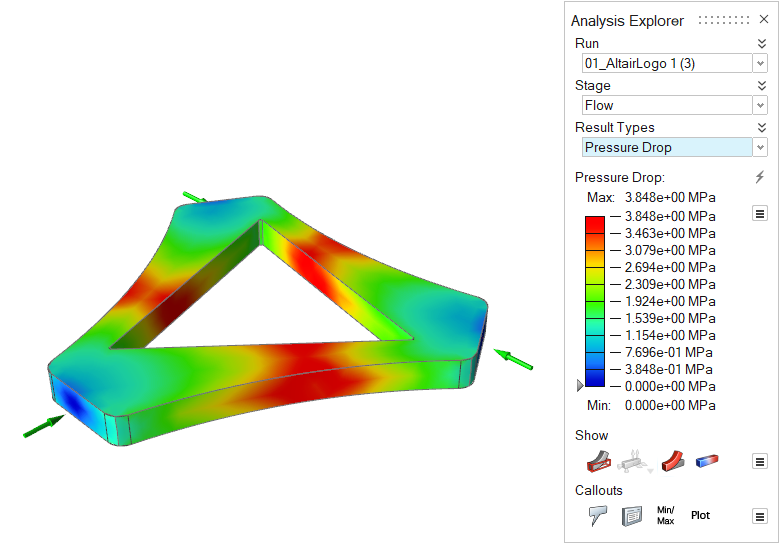 Note: Available in only in a quick analysis. |
| Weld Lines | Locate regions during filling where two flow fronts meet.
Such regions may cause structural and cosmetic issues.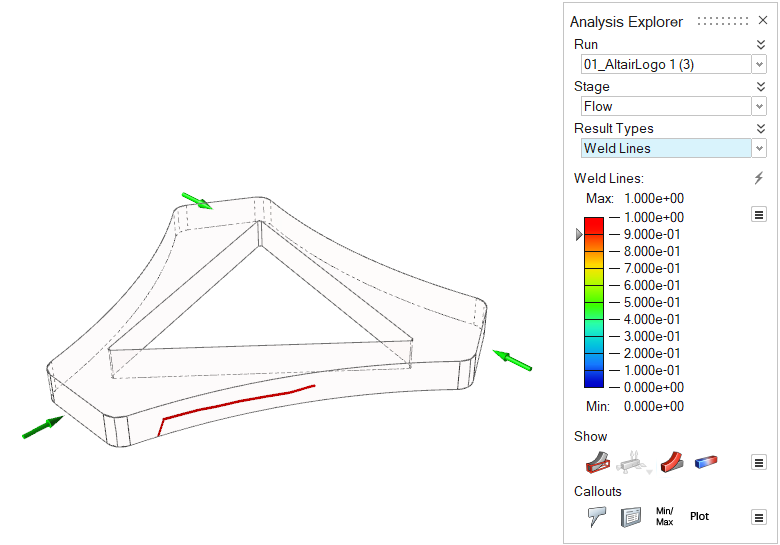 |
| Gate ID | Review the material that flows from each gate in a distinct
color.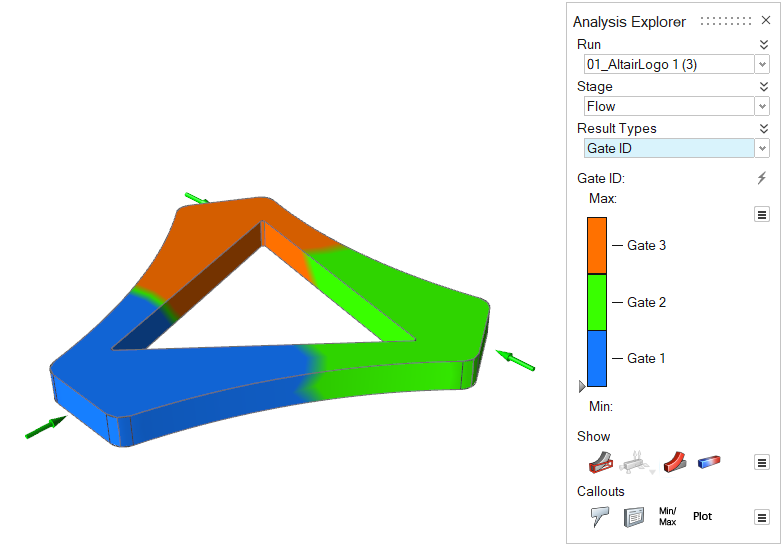 Note: Available in only in a quick
analysis. |
| Gate Contribution % | Review the percentage of material that enters the mold from
each gate. 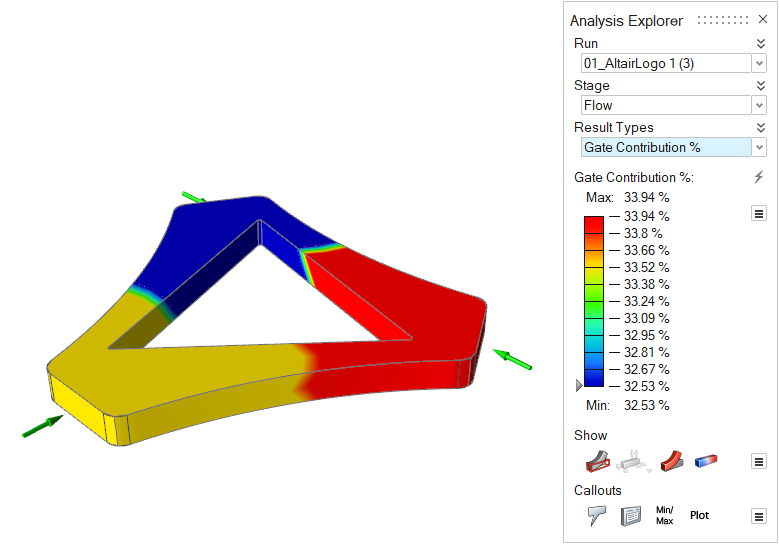 Note: Available in only in a quick
analysis. |
| Thickness | Review the thickness of different areas of the part. Local
part thickness affects local strain rates and heat flow. Abrupt
changes in thickness cause uneven cooling, which can lead to
part shrinkage and defects such as sink marks in the final part.
This result can give insight into the entire process.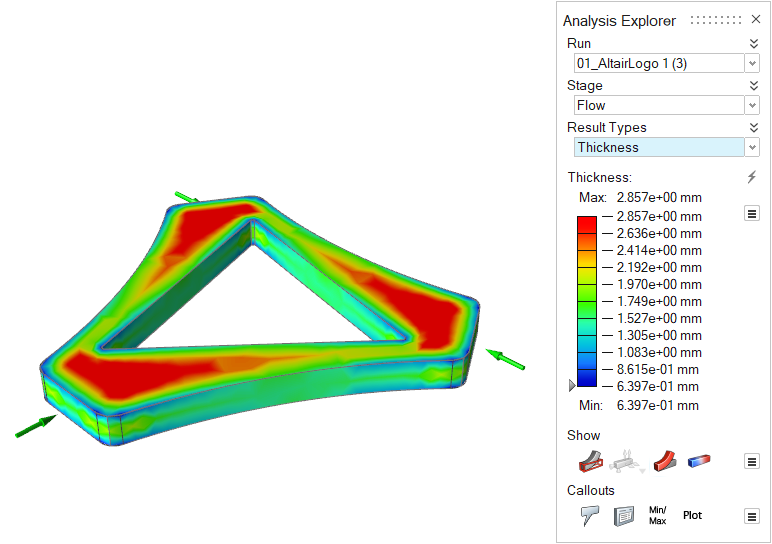 |
| Flow Length Ratio | Review the ratio between a region's distance from the ingate
to the average part thickness. Greater flow length ratio means
greater pressure is required to fill that region of the part
cavity.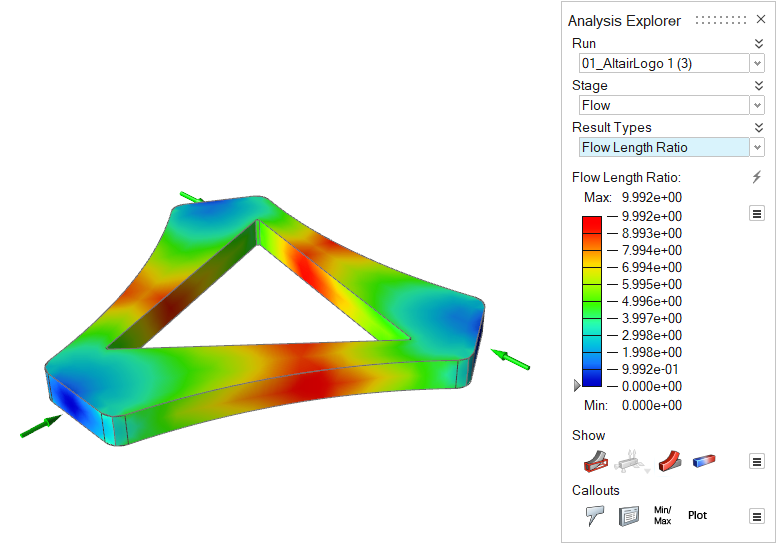 Note: Available in only in a quick analysis. |
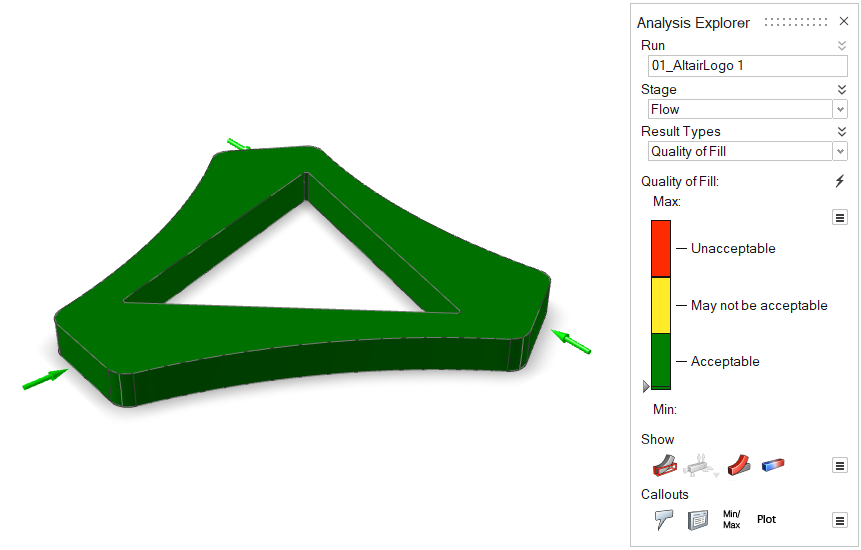
| Quality of Fill | View areas where material degradation and surface defects may
occur. To improve quality of fill, you can use a larger gate
size to increase flow rate, increase melt temperature to reduce
viscosity, increase part thickness to reduce shear heating, use
a less viscous material, or increase injection time to reduce
the shear rate of the melt. Note: Available in only in a quick analysis.
 |
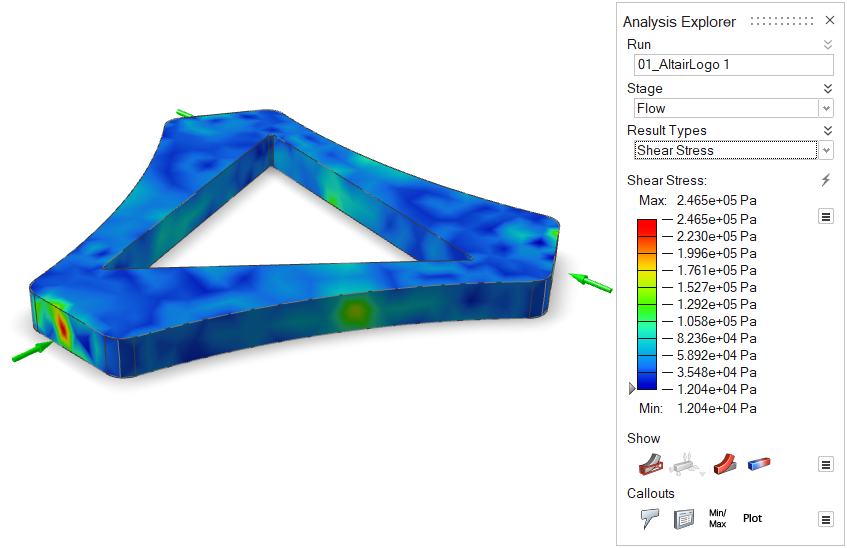
| Shear Stress | Review areas of high shear stress in the model. High shear
stress can lead to cracks in the finished part. Note: Available in only in a quick
analysis.
 |
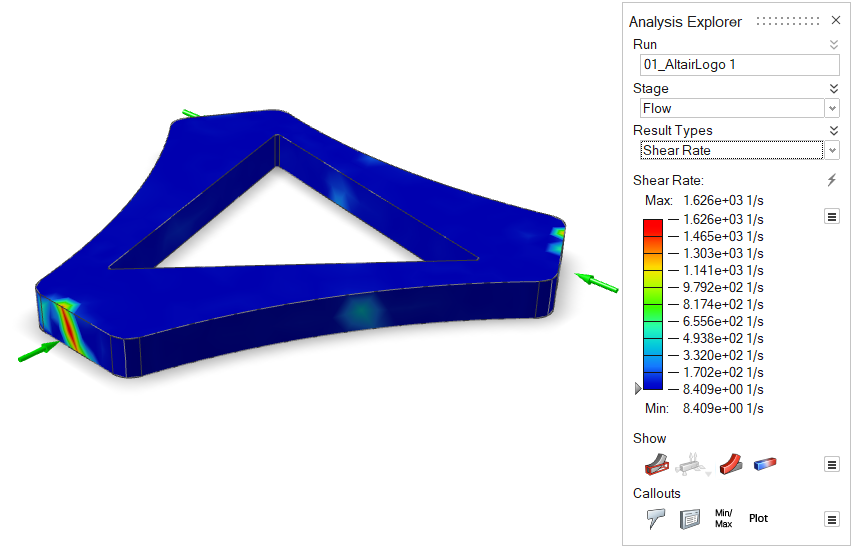
| Shear Rate | Review the shear rate of the material in the model. High
shear rate can lead to a brittle finished part with poor surface
finish. Note: Available in only in a quick
analysis.
 |
Sink Mark Results
| Option | Description |
|---|---|
| Sink Mark Index | Detect surface depressions, usually in the thicker sections
of the model, caused by shrinkage during the packing stage.
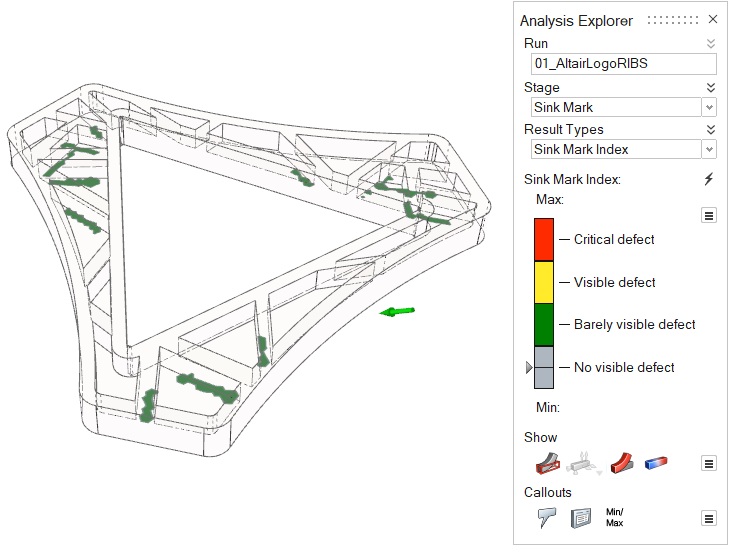 |
| Thickness | Review the thickness of different areas of the part. Local
part thickness affects local strain rates and heat flow. Abrupt
changes in thickness cause uneven cooling, which can lead to
part shrinkage and defects such as sink marks in the final part.
This result can give insight into the entire process.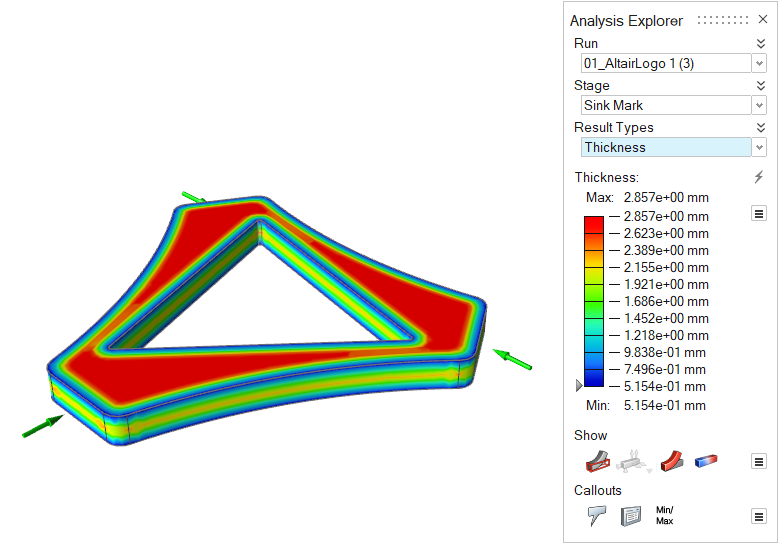 |