Select a Report
Select a report from the list to generate the report chart and to view its metrics.
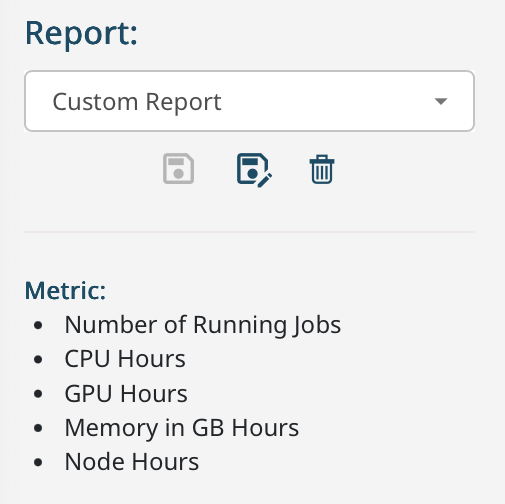
- Number of Running Jobs
- CPU hours
- GPU hours
- Memory in GB hours
- Node hours
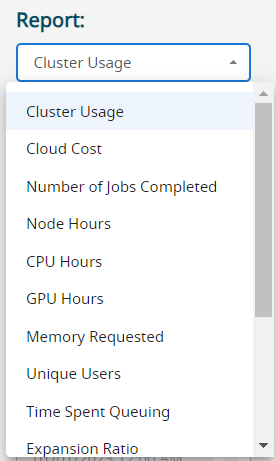
The following table provides the list of default reports:
| Report Name | Description | Metric Details |
|---|---|---|
| Cluster Usage |
Shows overall cluster usage for resource utilization as well as the number of jobs that were running during the selected time window. If the total resources available is listed in the database then the chart will show the resources used as a percentage of resources available and there will be a data series showing unused resources. Otherwise the resources used by each data series will be shown as a percentage of the total resources used. When there are more than 20 data series in the chosen grouping the chart will show the top 20 data series and group the rest into one data series called "other". In the table, all data series will be listed. |
|
| Cloud Cost |
Shows the cloud cost as calculated by the instance cost and proportion of the cloud instance used by the job as a proportion of the cores used. This value is also known as the burn rate. The jobs are accounted for at the end time. The actual amount billed by the cloud provider may vary from the estimated cost shown here. |
|
| Number of Jobs Completed Over Time |
This report shows the number of jobs completed during the time window selected. This report includes jobs that failed for any reason as well as jobs that succeeded. |
Number of Completed Jobs |
| Number of Jobs Completed |
This report shows the number of jobs completed during the time window selected. This report includes jobs that failed for any reason as well as jobs that succeeded. |
Number of Completed Jobs |
| Node Hours |
This report shows Node hours for jobs that have completed: (Frac's of Nodes used) * wallclockTimeUsed. (Frac's of Nodes used) = (slots used in the Nodes) /(slots available in the Nodes) Incase job ran with exclusive flag, 'Frac's of Nodes used' will be 1. All jobs that are running during the time window are included in the report provided they have now completed. |
|
| CPU Hours |
Shows CPU hours: slots * wallclockTimeUsed. All jobs that are running during the time window are included in the report provided they have now completed. |
|
| GPU Hours |
Shows GPU hours: gpusRequested * wallclockTimeUsed. All jobs that are running during the time window are included in the report provided they have now completed. |
|
| Memory Requested |
Shows total memoryRequested * wallclockTimeUsed. All jobs that are running during the time window are included in the report provided they have now completed. |
|
| Unique Users | Shows the number of unique users for jobs that completed during the time window selected. |
|
| Time Spent Queuing |
Shows the time jobs spent pending between job submission and job start: startTime - submitTime All jobs that were pending during the time window are included in the report provided they have now completed. |
|
| Expansion Ratio |
Shows the expansion ratio: (endTime - submitTime) / wallclockTimeUsed Expansion Ratio is the ratio of the time spent pending + running against the time spent running. Shows the number of jobs with Expansion Ratio in the given range for jobs that completed during the time window selected. |
|
| Idle Jobs |
Shows jobs where the the cpuTimeUsed is very low vs. the wallclockTimeUse for jobs that completed during the time window selected. Reasons can be:
|
|
| Wallclock Requested vs. Used |
Compares the wallclock requested as a percentage of wallclock used. Shows the number of jobs with a percentage of wallclockTimeUsed vs wallClockTimeRequested in the given range. |
|
| Memory Requested vs. Used |
Compares the memory requested as a percentage of RSS memory used. Shows the number of jobs with a percentage of physicalMemoryUsed vs memoryRequested in the given range. |
|
| Job Runtime | Shows wallclockTimeUsed grouped into runtime buckets for jobs that completed during the time window selected. |
|
| Job Summary Report |
Provides a table of primary metrics per job for jobs that completed during the time window selected. The table will only show the first 1000 results. Please set filters to narrow down the results. |
|
| Fairshare Groups Walltime | Fairshare Groups Walltime in historical reports reflects the total walltime consumed by tasks in a Fairshare queue. This metric helps evaluate the overall resource usage and efficiency of jobs within the Fairshare framework. The value is rounded off to 2 decimal places. |
|
| Fairshare Groups Wait Time | Fairshare Groups Wait Time in historical reports reflects the duration tasks spent waiting in a Fairshare queue before being scheduled. This metric helps assess system workload, resource contention, and how fairly resources are allocated among users or groups over time. The value is rounded off to 2 decimal places. |
|
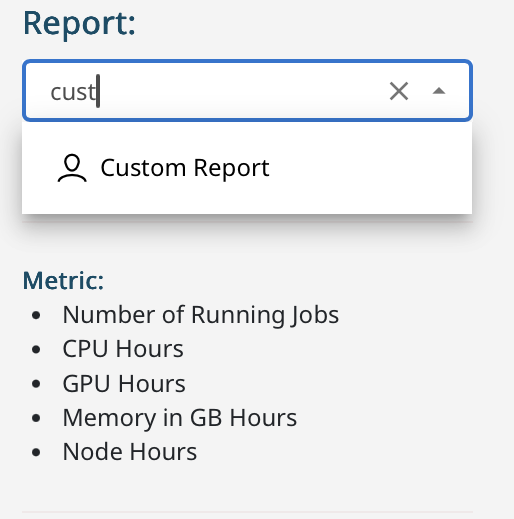
Custom Reports
- To save a new report , click
 under the Report list. Provide a name and click
Save in the Save Report
page.
under the Report list. Provide a name and click
Save in the Save Report
page. - To save changes to an existing report, click
 under
the Report list. Click Yes in
the Update Saved Report page.
under
the Report list. Click Yes in
the Update Saved Report page. - To delete the report, select the report and click
 under the Report list. Click
Yes on the Delete Saved
Report page.
under the Report list. Click
Yes on the Delete Saved
Report page.