Report Chart
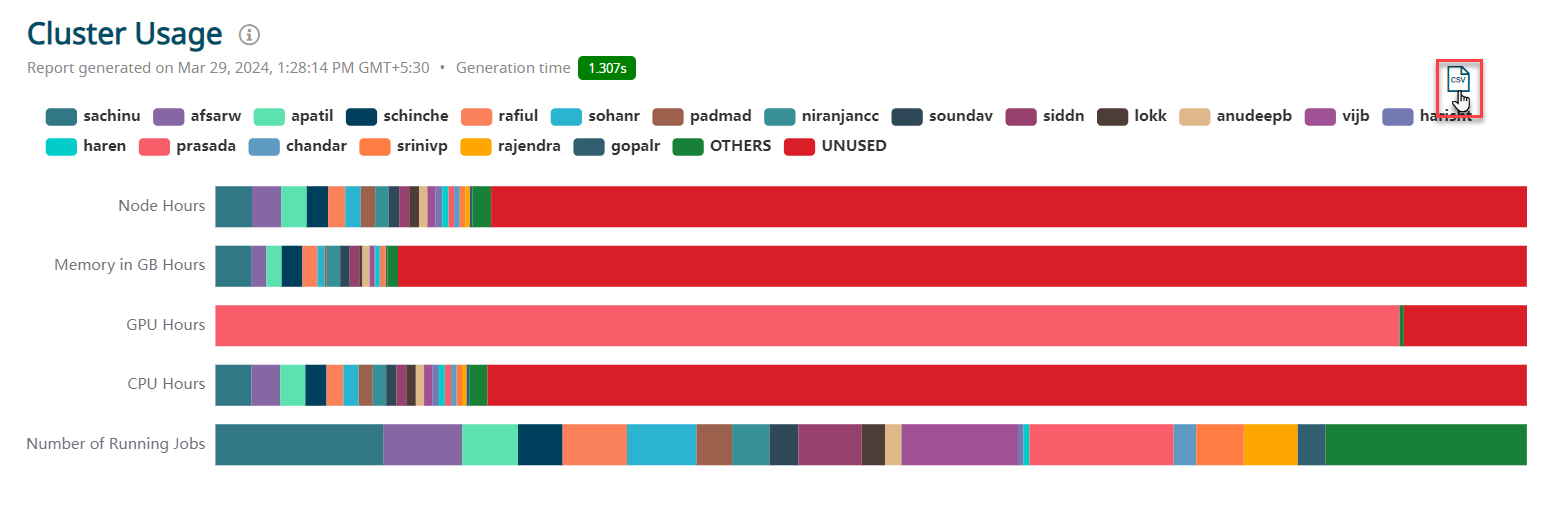
View the generated report chart and download it in the CSV format.
The report chart is generated based on the report that is selected and with the
filters that are applied.Figure 1. Report Chart
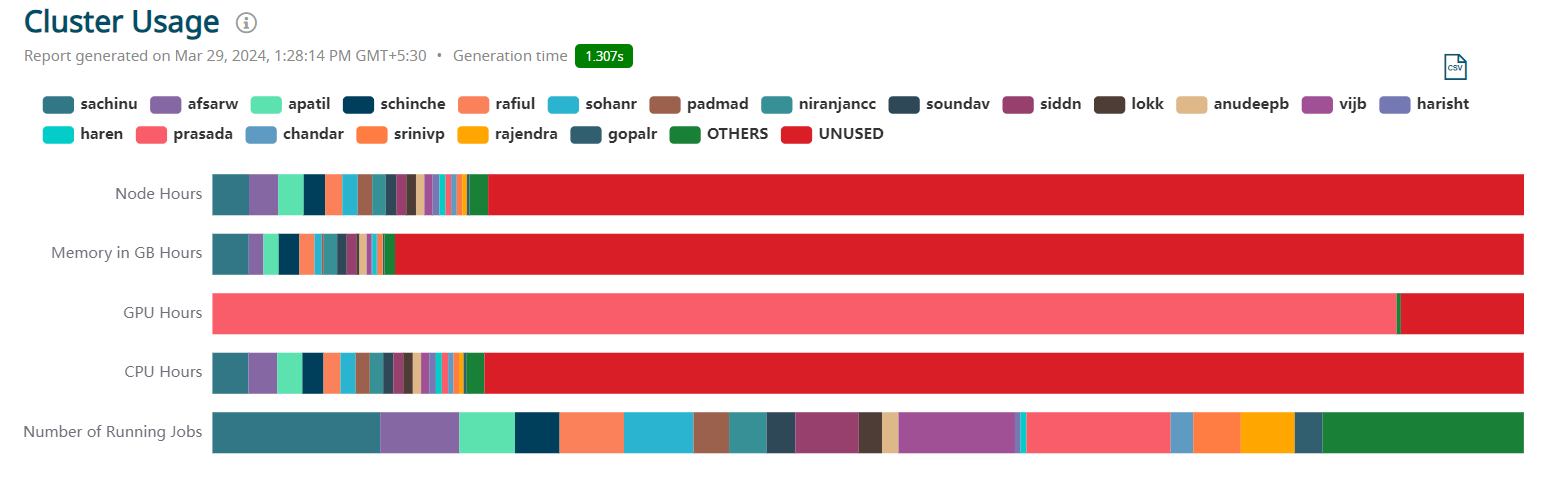
In this example, Cluster Usage report is selected which represents the Owner in the X-axis and the report metrics in the Y-axis.
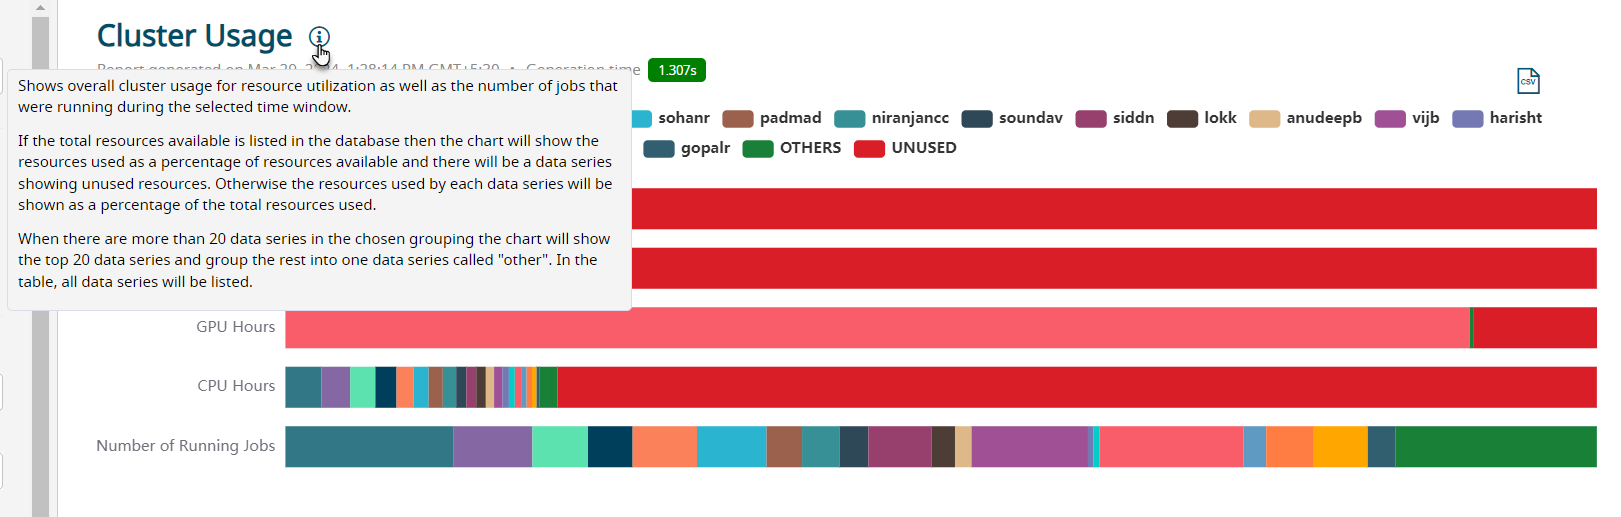
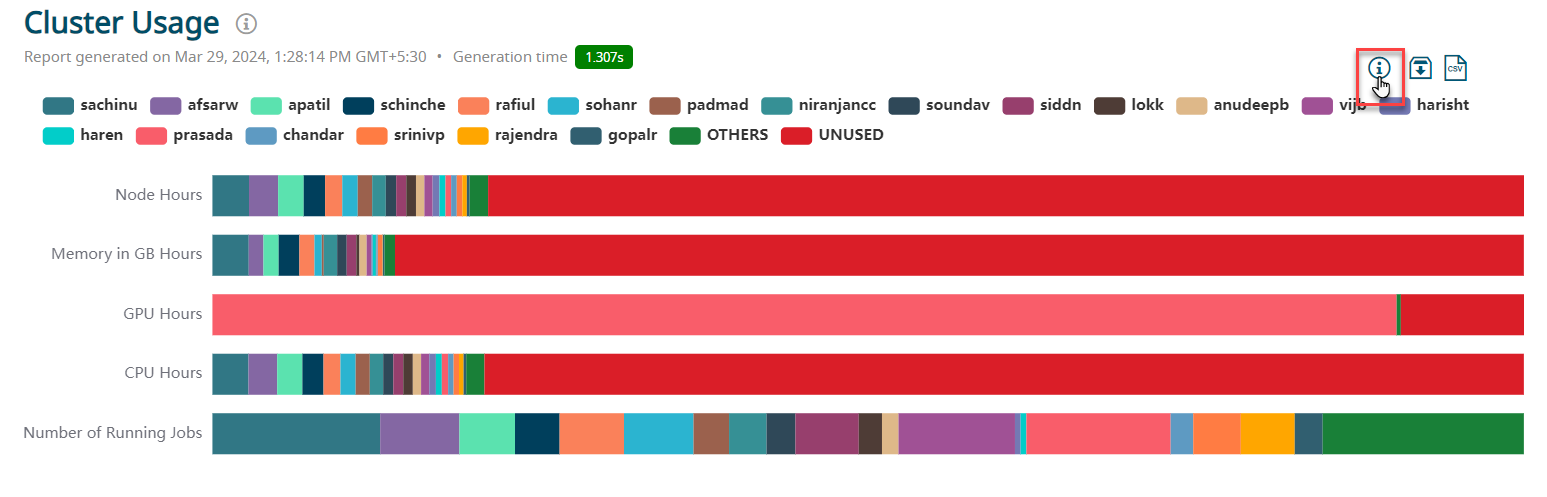
Click  next to the report name to view the information of this
report.
next to the report name to view the information of this
report.Figure 2. Report Chart Information
You can perform the following actions:
- View the chart based on the legend
- View the chart query
- Download the chart in the CSV format
- Expand or collapse the chart
Report Legend
Color legend is provided at the top of the chart. By default, the X-axis parameters are denoted as the legends.
To view the chart for an individual owner, you can:
- Mouse hover the legend color in the chart.
Figure 3. Owner Chart - Mouse Hover 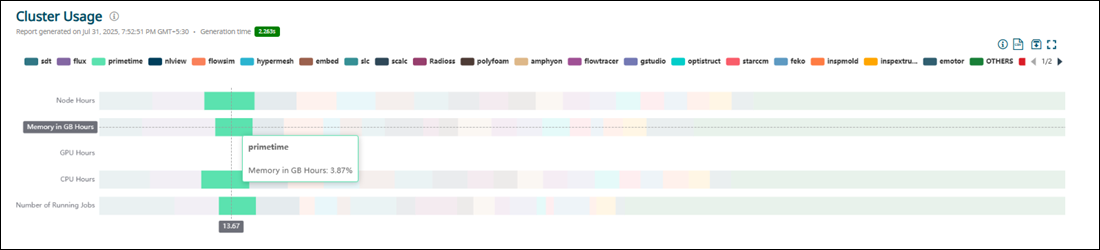
- Select the owner legend color at the top.
Figure 4. Owner Chart - Select Legend 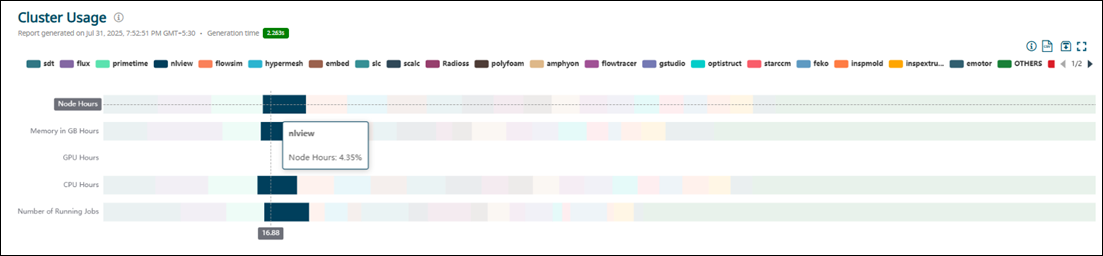
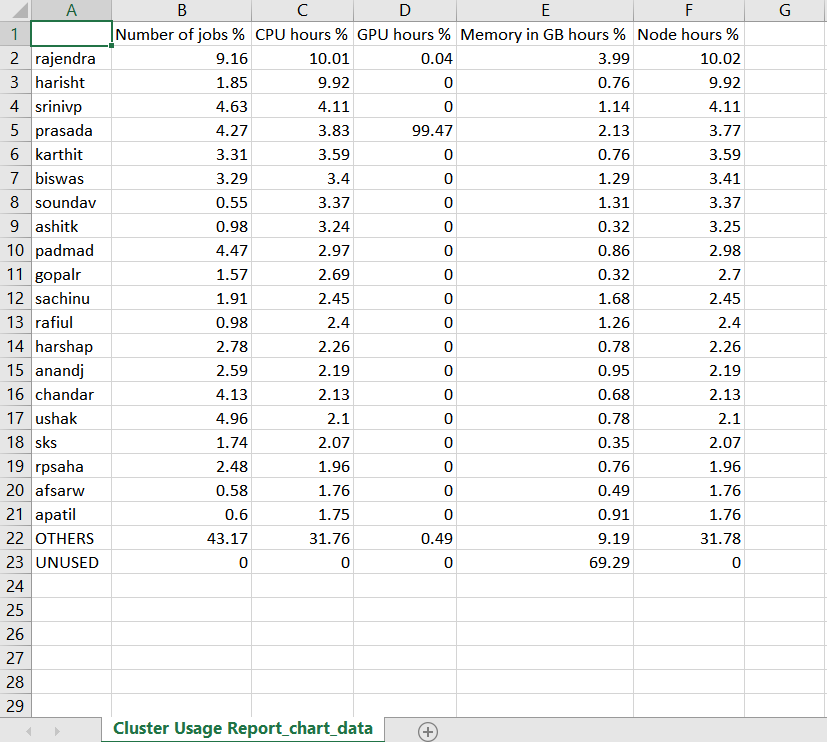
Download the Report Chart
The report chart can be downloaded in the CSV Format. Click  to
download the report.
to
download the report.Figure 5. Download the Report Chart
The report will be downloaded in the CSV format.Figure 6. Report Chart - CSV Format
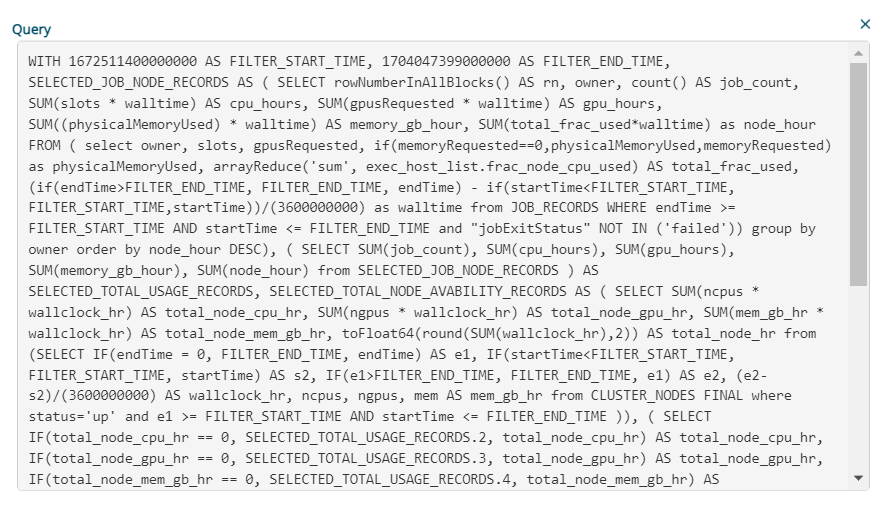
View the Chart Query
Note: Enable debug query from the settings to view the chart query.
Click to view the query that is used to generate the
report.Figure 7. Report Chart - Query Information
The Query that is used to generate the report is displayed.Figure 8. Report Chart Query
Expand or Collapse Chart
Click ![]() to
view the chart in full screen and hide the report summary.
to
view the chart in full screen and hide the report summary.
Click ![]() to
collapse the chart and display the report summary.
to
collapse the chart and display the report summary.