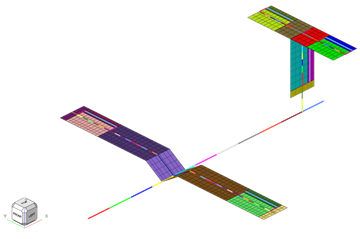
The model is symmetric about the X-Z plane and the structural domain consists
of a stick model with CBAR and CELAS2
elements. Flutter analysis is performed for a Mach number of 0.3, density ratio of
1.0, and equally spaced reduced frequencies in the range [0.50, 1.50] Hz. Unit of
output velocity is defined in knots using PARAM, VREF.
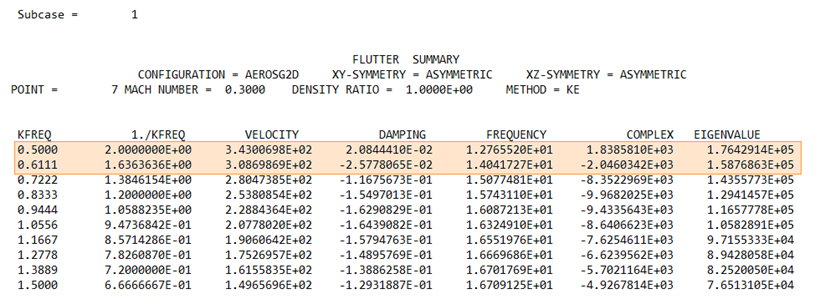
Results
From the .flt file, the flutter point (where damping changes
sign) corresponding to the lowest mode is identified as the 7th mode
(flutter point A) with a velocity between 308.698 knots to 343.006 knots.
Note: By
definition, instability (flutter or divergence) occurs when the damping values
are zero. At this point, if the frequency is zero, then the instability is due
to divergence. Otherwise, the instability is due to flutter.
Figure 2. Flutter Analysis Summary from the .flt
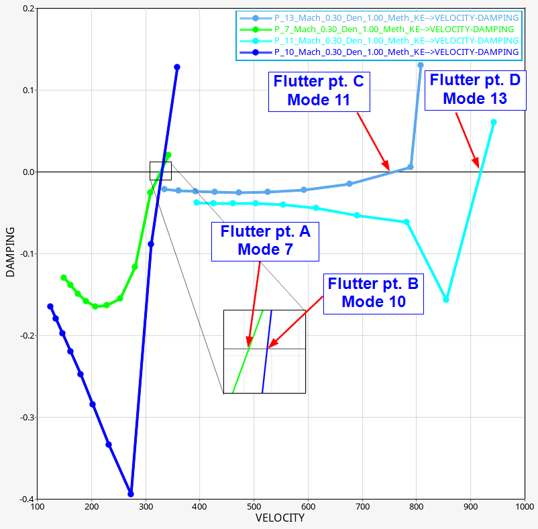
File Plotting the v-g curve, the velocity at this flutter point is 327.668 knots.
This is the most critical flutter point that needs to be avoided.
Figure 3. Identify Flutter Points. The flutter point corresponding to the lowest velocity is also visually
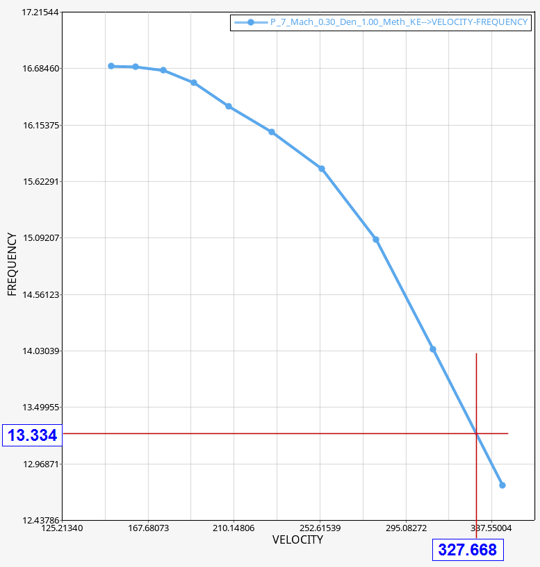
identified. Figure 4. Identify Frequency Value at the Critical Flutter Point from
the v-f Curve. Plotting the v-f plot for the 7th mode (corresponding to the
critical flutter point), the frequency value for 7th mode at a velocity
of 327.668 knots is determined as 13.334 Hz.
The results from the OptiStruct flutter analysis
are verified.
Note: The slight difference in flutter speed may be attributed to:
Uncertainties in the model. The precise geometry, damping, and other
data used in the reference are not known and may differ from what was
used in OptiStruct1.
The order approximation for the DLM kernel. The order used in the
reference is not known and may differ from what was used in OptiStruct1.