Transfer Path Analysis - Study
Perform a Partial sum, Modify path, Path overlay, or Randomization response study.
To enable this option, you must first plot the path contribution curves.
- Subcase
- Select a subcase to study from the drop-down menu.
- Study path contribution by
- Choose between RPM or Frequency.
- Frequency range
- Indicates the available range, based on the frequencies your TPA has performed.
- Type
- The response study type.
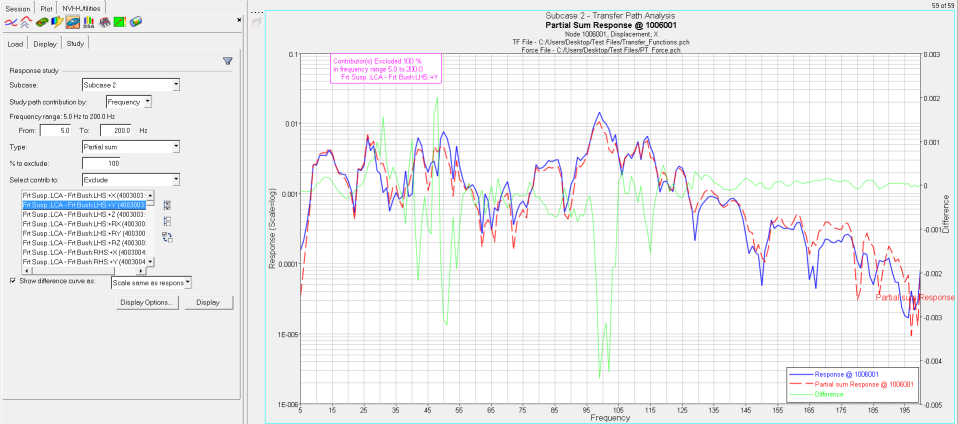
- Partial sum
- Select the path contributions to exclude from the TPA response, with an optional percentage to exclude.
- Modify path
- Activate path modifications from the Path details dialog, and overlay the TPA response from the modified path with the original TPA response.
- Path overlay
- Select the specific path contribution curves to overlay with the TPA response.
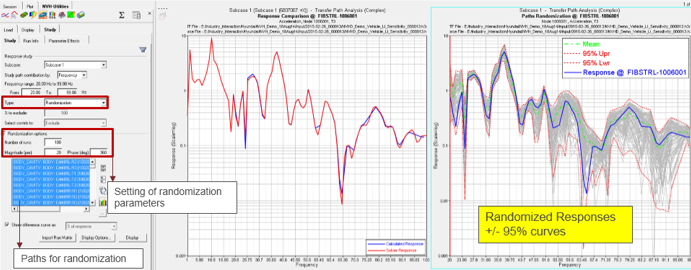
- Randomization
- Select the paths for randomization.
- % to Exclude
- Optional field that allows you to exclude a percentage of the path contributions from the TPA response.
- You can also filter path contributors to a smaller set by clicking the
Filter Contributor icon
 to
display its dialog.
to
display its dialog. - Select contrib. to:
- Select the path contributions that you want to exclude or include in the response study.
- Click All
 to select the entire list of path
contributions.
to select the entire list of path
contributions. - Click None
 to deselect your current selections.
 - Click Flip
 to exchange the currently selected path
contributions for the unselected path contributions in the
list.
to exchange the currently selected path
contributions for the unselected path contributions in the
list. - Randomization Options
- These options are active only when the Randomization option is chosen from the Type drop-down menu. You can enter the number of randomization runs as well as the magnitude and phase for the randomization of the selected paths.
- Sum selection to one contributor
- Sums selected contributors into one contributor for overlay. Only available for the Path overlay study type.
- Show difference curve as
- Shows a difference curve between the original TPA response and the
Partial sum or the Modified path TPA response curves.
- % of response
- Difference curve shows the difference as a percentage of the original TPA response.
- Scale same as response
- Difference curve shows the difference using the same scale as used in the response plot.
- Display Options
- Launches the Display Options dialog, which allows you to further customize the plot.
- Display
- Displays the response study plot once your selections are complete.