Modal Participation
Plot modal/panel participation curves from an OptiStruct .h3d file or an MSC Nastran .f06/.pch file.
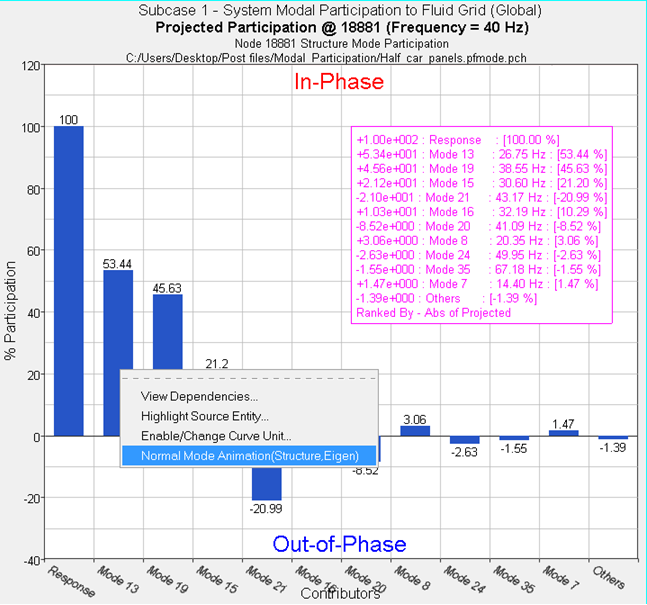
Modal participation represents the complex contribution of a structure or fluid mode to a response. These modes can be systems modes in a modal frequency response analysis or component modes from CMS superelement subsystems. Modal participation can be output from a modal frequency response analysis using the PFMODE output request card.
Panel contribution represents the complex contribution of all grids on a structural panel to a response. It can be output from a modal frequency response analysis using the PFPANEL output request card.
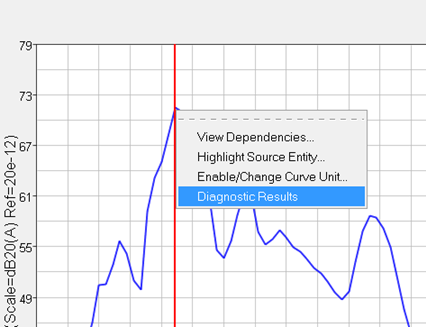
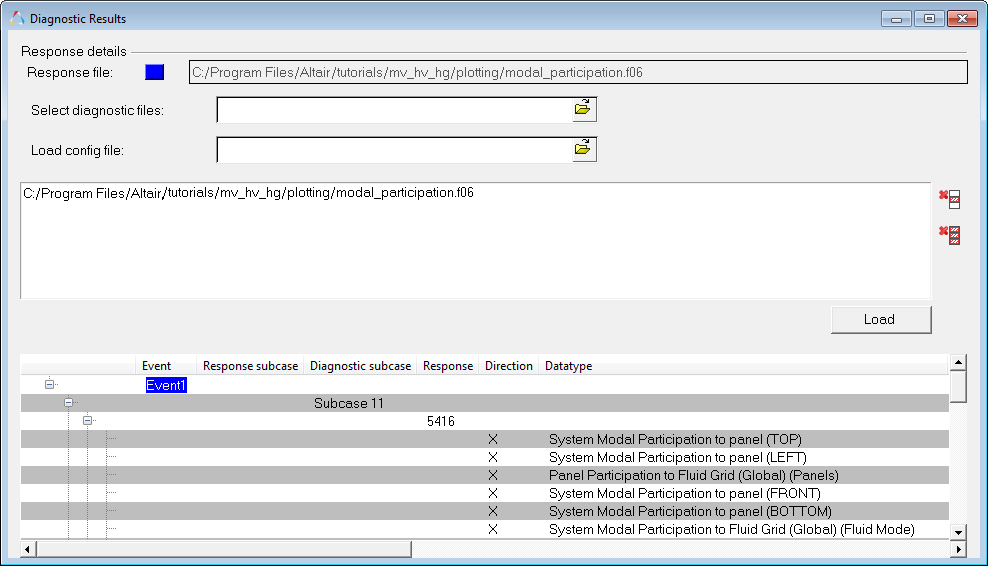
Normal modes data can be associated with modal participation results using the Diagnostic Results option, located on the context menu of the response plot. After loading the file's data, select and load a normal modes data file from the Diagnostic Results dialog and click OK. The dynamic context sensitive menu option Normal Mode Animation is available from the modal participation bar plot. When selected, a normal modes animation plot is generated.