Modal Participation - Study
After plotting modal/panel participation curves, perform a Partial sum or Contributor overlay response study. The Study tab contains three subtabs: Study, Run Info, and Parameter Effects.
Study
- Frequency range
- Indicates the available range, based on your PFMODE.PCH or .f06 file.
- Type
- The type of response study.
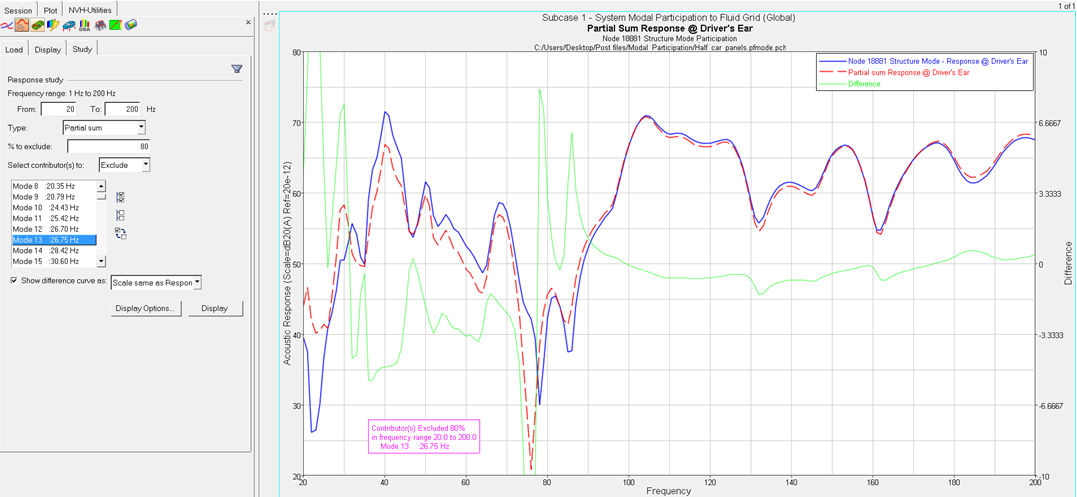
- Partial sum study
- Select the number of contributors to exclude from the response, with an optional percentage to exclude.
- Contributor overlay
- Select specific contributors to overlay with the response.
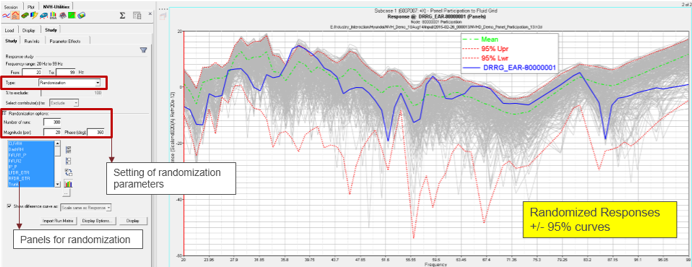
- Randomization
- Select modes/panels for randomization.
- % to Exclude
- Optional field that allows you to exclude a percentage of the contributors from the response.
- Randomization options
- These options are active only when the Randomization option is chosen from the Type drop-down menu. You can enter the number of randomization runs in addition to the magnitude and phase for the randomization of modes/panels.
- Select contributor(s) to:
- Select the mode(s)/panel(s) that you want to exclude or include in the
response study.
- Click
 to select the
entire list of contributors.
to select the
entire list of contributors. - Click
 to deselect your
current selections.
to deselect your
current selections. - Click
 to exchange the
currently selected contributors for the unselected contributors
in the list.
to exchange the
currently selected contributors for the unselected contributors
in the list.
- Click
- Show difference curve as
- Shows the difference between the original curve and the partial sum curves.
- Calculate Partial Sum for all responses
- Import Run Matrix
- Display Options
- Launches the Display Options dialog, which allows you to customize the response study plot, including scale, weighting, and the plot layout.
- Display
- Click Display to display the response study plot once your selections are complete.
Parameter Effects
- Bar
- Creates a bar plot of the response at a specific frequency.
- 3D Bar Plot
- Creates a plot of modal/panel participations to a 3D Bar plot.
- Show contrib.
- Select the number of contributors to display.
- Rank by
- Selected a ranking method.
- Display Options
- Use the Display Options dialog to further customize the plot.
- Display
- Click Display to create and display the plot.