Transfer Path Analysis - Load
Load a file and view transfer path details.
File Selection
- File selection
- From , select from the following file types:
- Configuration
- Select a previously saved .csv file and click Load. The Path identification fields are populated in the section below.
- Transfer Function
- Select one of the following file types, where Transfer
Function output is available.
- OptiStruct .pch or .h3d file
- Nastran .pch file
- Test .unv file
- Force
- Select one of the following file types, where Force output
is available, then click Load.
- OptiStruct .pch or .h3d file
- Nastran .pch file
- Test .unv file
Path
- Click Path Details to view transfer path details, or Apply to confirm the path detail configuration.
If the Transfer function field is populated, but the Force field is left blank, you will be asked to confirm that you intend to proceed with the TPA analysis with assumed forces.
If you click Yes, a dialog is displayed. From this dialog, you can either accept the default unit forces or enter another scalar (target) value, which will be used to generate an assumed force file for use in the TPA analysis.
Subcase
Subcase identification identifies the subcase type and the subcase ID to RPM or principal component relationship.
If subcase is General, simply select a subcase and click Apply to move to .
If subcase is Spindle Loads - Selected, then the subcases are interpreted as subcases related to principal components to be used as spindle input for TPA analysis.
If subcase is Engine Loads - Selected, then subcases are interpreted as subcases related to input at various RPMs to be used for TPA analysis.
Response
- Result selection
- The following fields are available under Result selection.
- Subcase
- Select an analysis subcase.
- Result type
- Select one of the available result types.
- Response ID
- Grid ID of the response for which Modal/Panel participation results are available. Select a response ID from the list.
- Response label (optional)
- Enter a label that describes the response, for example "Driver’s Ear".
- Direction component
- X, Y, or Z.
- Contribution analysis
- The following fields are available under Contribution analysis. Once the
result selection options are complete, select Load
Response to further investigate the contributions.
- Sum paths by
- Select how contributions from various paths are to be summed.
- Sum subcases by
- Select how contributions from subcases are to be summed.
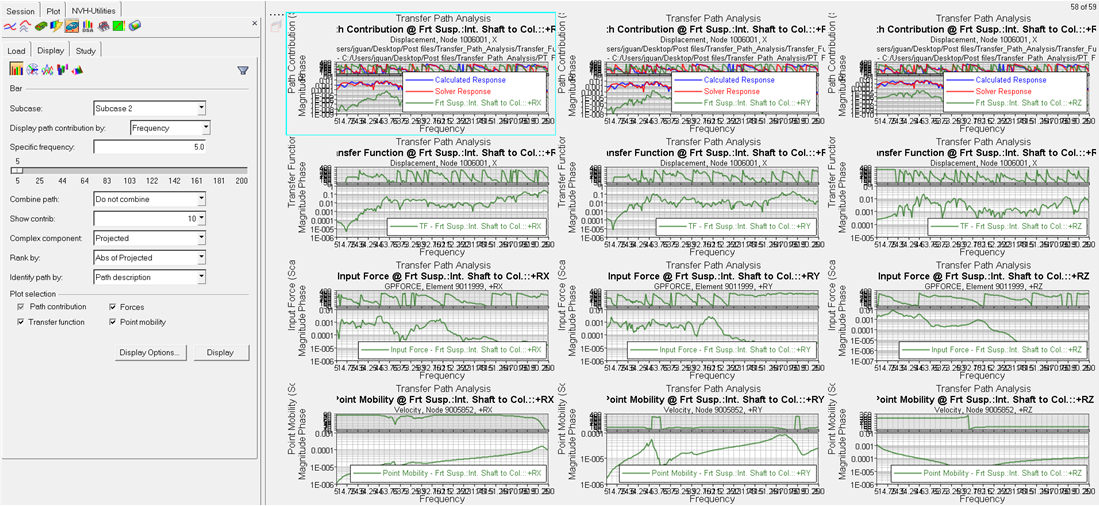
- Generate all path contribution plots
- When checked, contribution plots of all paths are generated with three paths on each page.
- Display Options
- The Display Options dialog allows you to customize the response plot, including scale, weighting, and the plot layout.
- Load Response
- Once the result selection options are complete, select Load Response to display the file data.