Exterior Noise - Display
After plotting the response for sound pressure, review the structural contribution with respect to contours and view Directivity for the selected concerned frequency or list of frequencies.
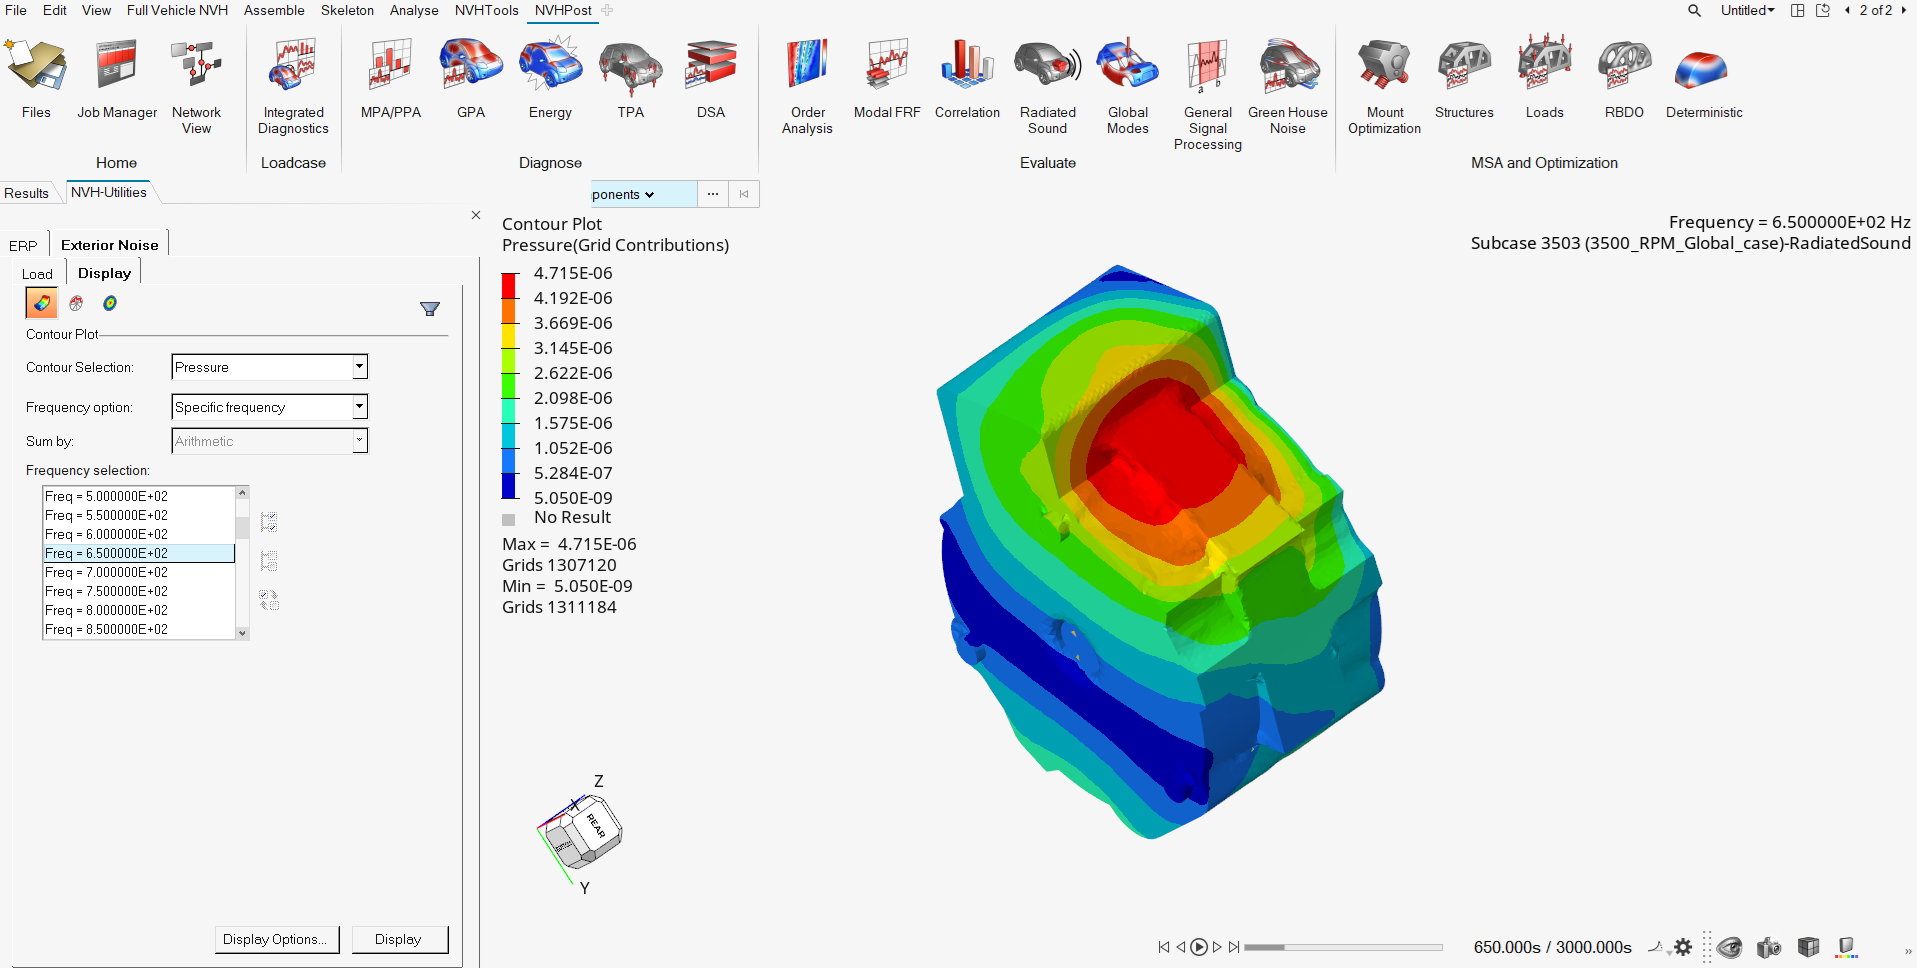
Contour
- Select the concerned frequency or list of frequencies.
- Display the contour.
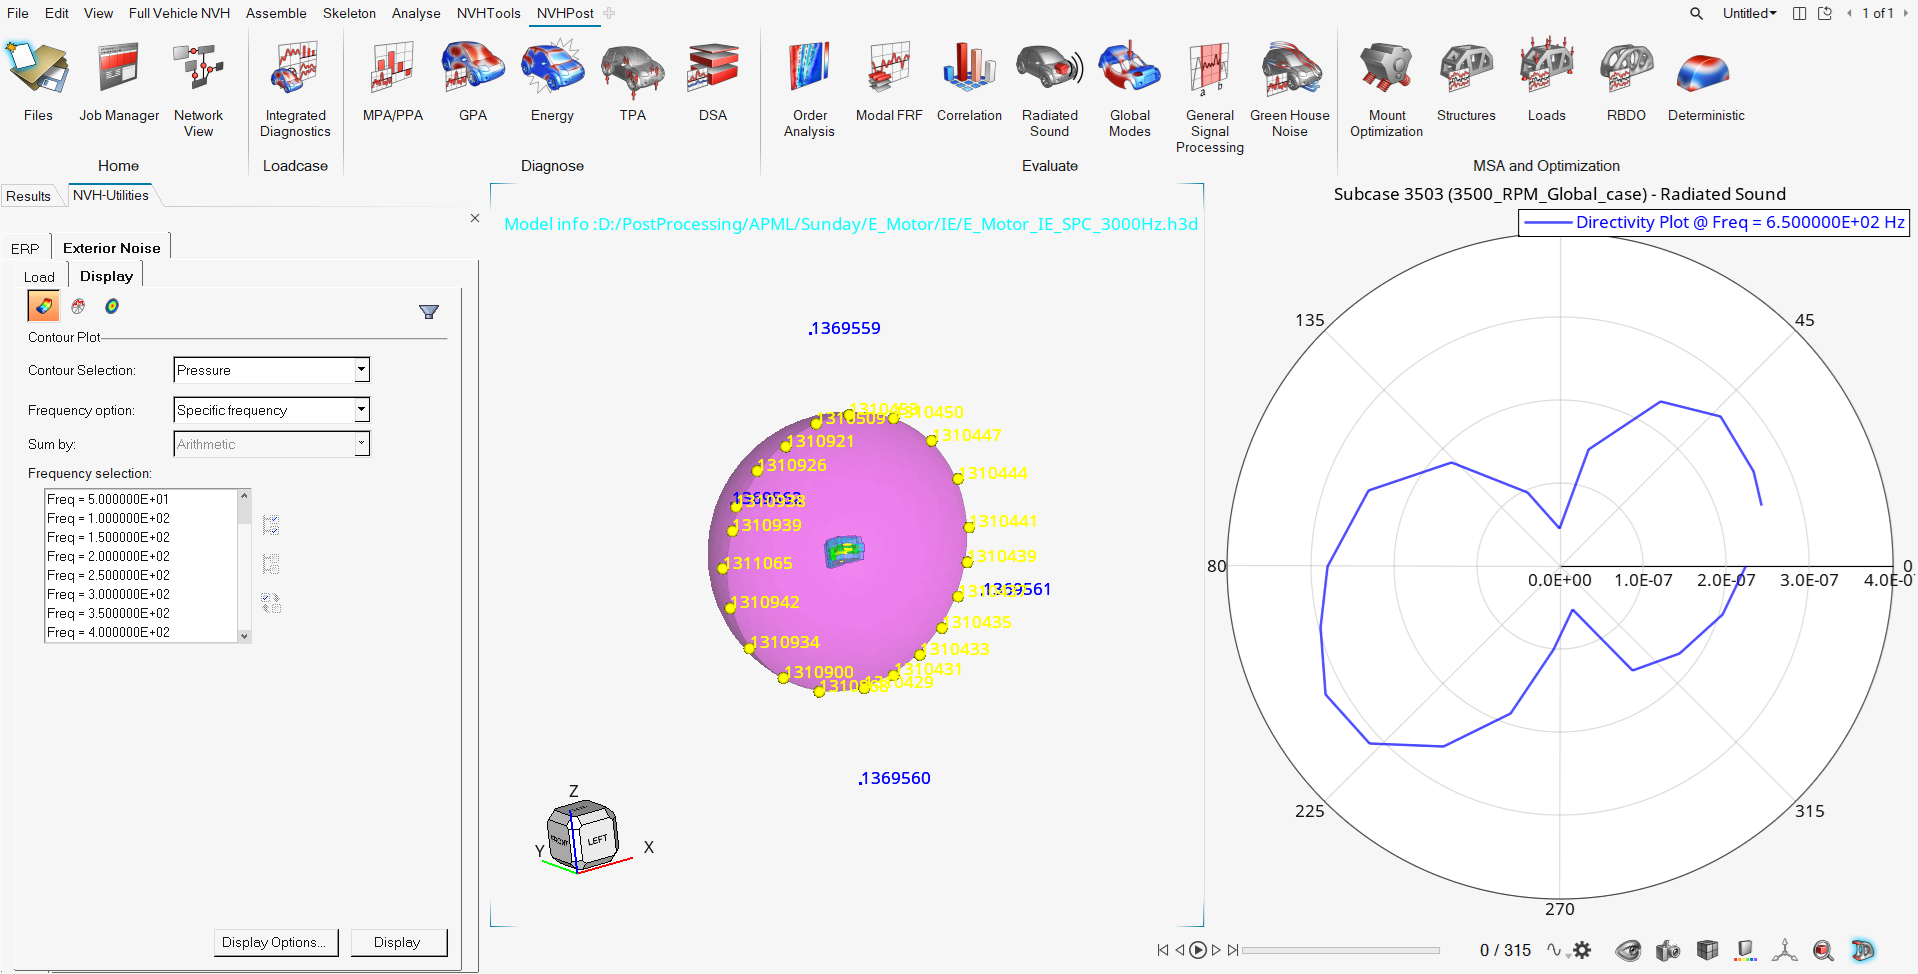
Directivity
- Select microphones by graphical node picking, from sets, or from an external CSV file.
- Select the concerned frequency or list of frequencies.
- Display the directivity plot.
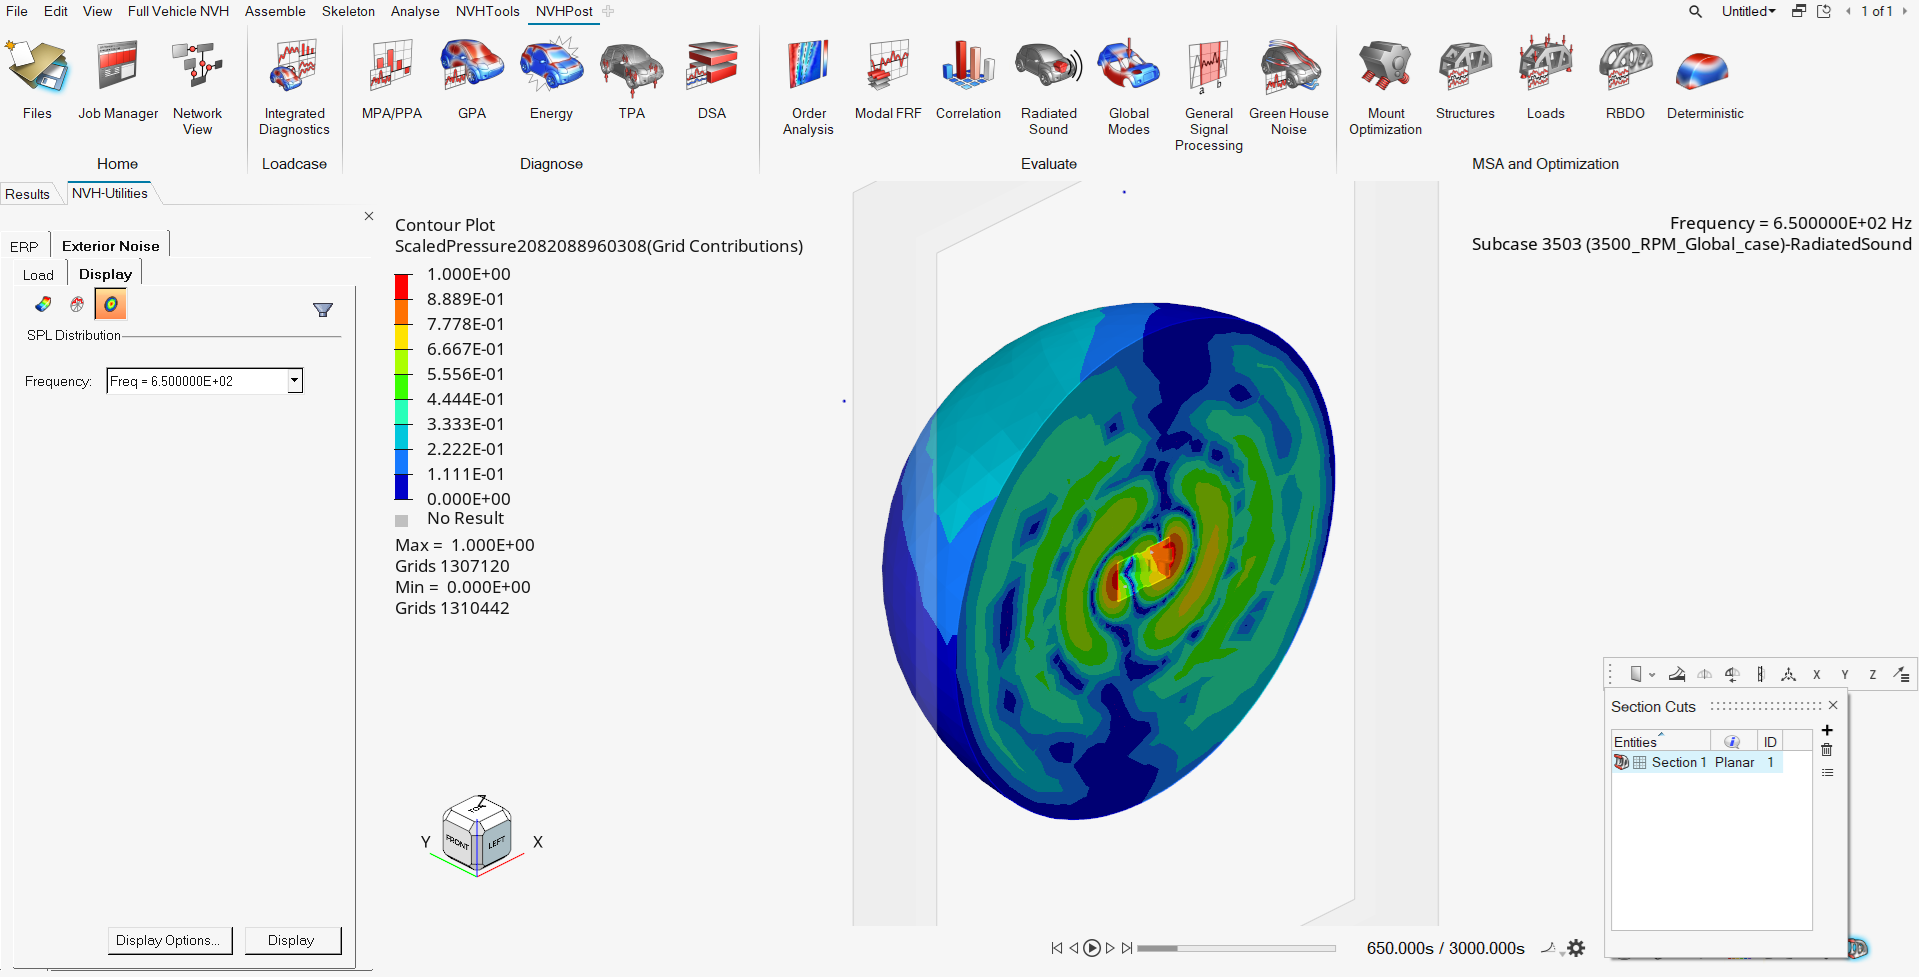
SPL Distribution
- Select the concerned frequency and plot the contour for the sound pressure in the near field acoustic mesh.
- An option is available to cut the planes and see the distribution of sound pressure levels.