Integrated Diagnostics - Contributions
Perform contribution analysis for the vehicle response between sensitivity and forces.
- The Loadcase Processing tab.
- The vehicle response calculated or loaded.
- On the Vehicle Response tab, the loadcases selected or the files selected for the Power Train Input or Road Profile Input options.
Order Contribution
The overall response is plotted after you have selected the power train input loadcase on the Vehicle Response tab along with the corresponding sensitivity and forces result file on the Loadcase Processing tab. Use the Order Contribution tab to plot the waterfall diagram and perform an order cut analysis.
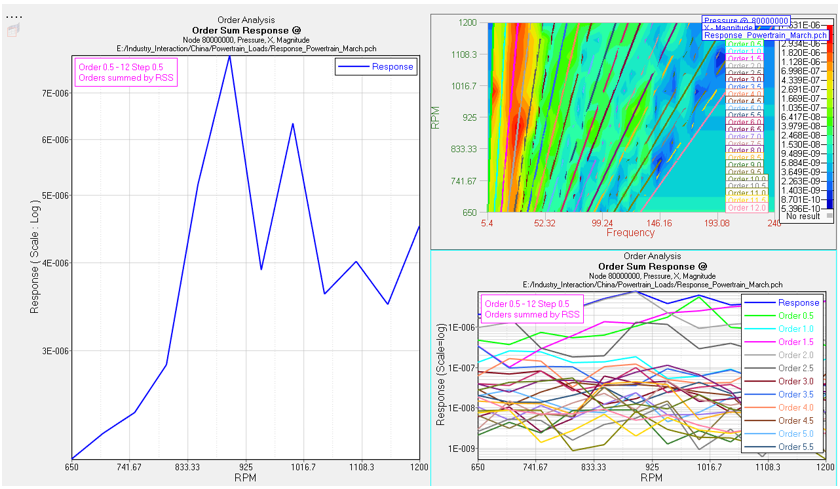
- Order cuts
- After viewing the surface plot, use the Start, End, and Step fields to specify the orders you want to see by cutting the surface plot.
- Plot selection
- Select from Bar, 2D Line,
or 3D Surface.
- Bar
- Creates a bar plot of the response at a specific frequency or RPM.
- 2D Line
- Creates a 2-D line plot of the response for a range of
frequency or RPM.
- RPM range
- Select the RPM range that the order curves should be plotted within.
- No. of highest order
- After defining the RPM range, organize the display by selecting the number of highest orders.
- Rank by
- Define the method that is used to rank orders
with one of the following options:
- RSS Magnitude: Orders are ranked by the root sum of squares of the magnitude of the order at selected frequencies. Available for 2-D line and 3-D surface plots.
- 3D Surface
- Creates a 3-D Surface plot of the response within an RPM range.
Load Path Contribution
After you have selected the powertrain input loadcase on the Vehicle Response tab, along with the corresponding sensitivity and force results file on the Loadcase Processing tab, use the Load Path Contribution tab to perform contribution analysis with respect to the sensitivity and forces for an RPM subcase based on the vehicle response.
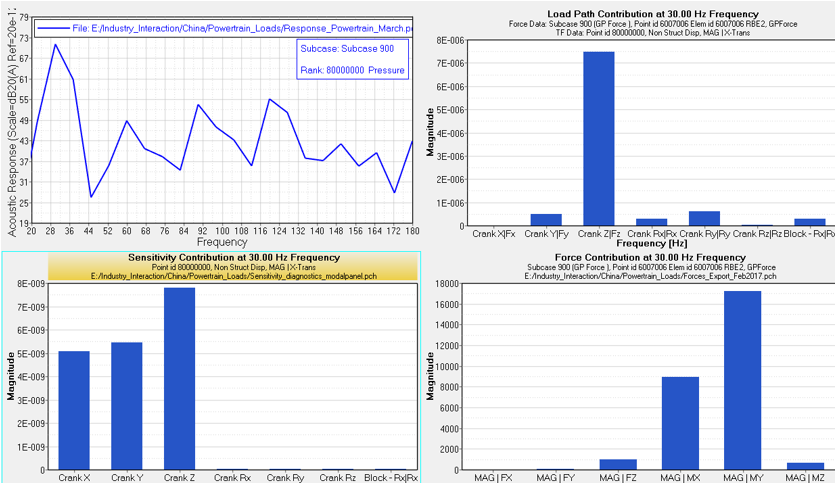
- Bar
- Creates a bar plot of the response at a specific frequency.
- 2D Line
- Creates a 2-D line plot of the response for a range of frequency.
- Frequency range
- Select the frequency range that the response curves should be plotted within.
- Plot Selection
- Select from the following options:
- Load Path Contribution
- Sensitivity
- Force Contribution
Wheel Contribution Tab
After you have selected the road profile inputs loadcase on the Vehicle Response tab, along with the corresponding sensitivity and force results file in the Sensitivity and Forces tab, the Wheel Contribution subtab allows you to perform a contribution analysis with respect to the wheel contribution and sensitivity for a vehicle response, corresponding to the random loads subcase.
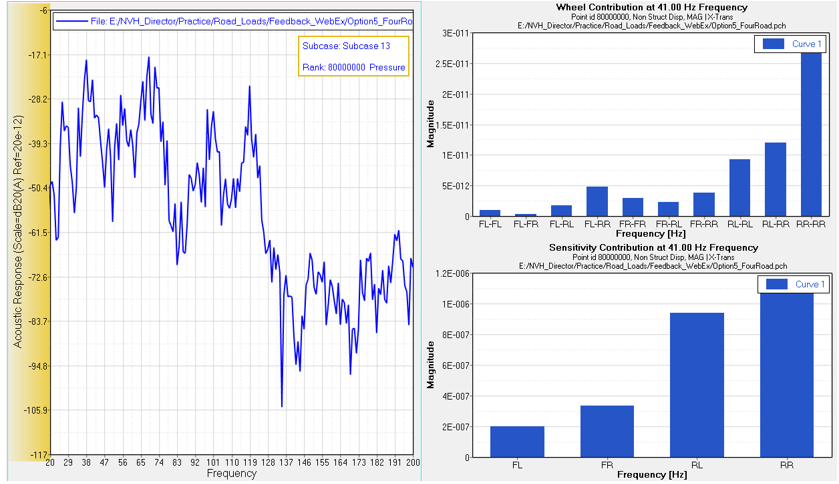
- Bar
- Creates a bar plot of the response at a specific frequency.
- 2D Line
- Creates a 2-D line plot of the response for a range of frequency.
- Frequency range
- Select the frequency range that the response curves should be plotted within.