
Enter Data Using the Table and Plot Area
Use the table and the plot area together to create, edit, and visualize input points for varying data sets.
The table and plot area are available in tools throughout HyperMesh CFD when defining varying data, such as piecewise linear functions or cubic splines. Any data edited in the either the table or the plot area dynamically updates the other.
-
Add and remove points from the table.
Option Description 
Insert a value before the first data point. 
Insert a value after the selected data point. 
Insert a value after the last data point. 
Delete the selected data point. -
Define the location of the points in the following ways:
- Enter coordinates in the table.
- Click and drag a point in the plot area.
Figure 1. 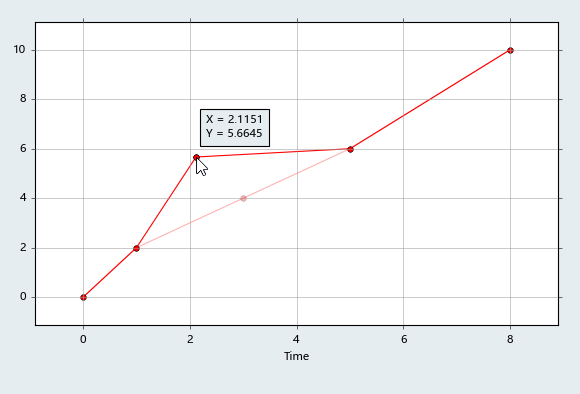
Use window selection to highlight multiple points then left-click and drag to move all the selected points at once.Figure 2. 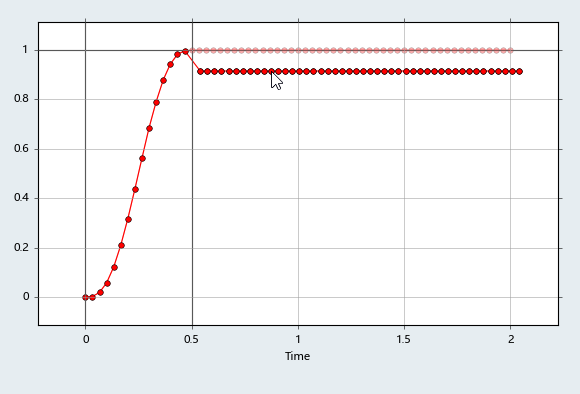
Tip:
- Click
 to import a table data
from a .csv file.
to import a table data
from a .csv file. - Click
 to export table data as
a .csv file.
to export table data as
a .csv file. - Middle mouse scroll to zoom in and out of the plot area.
- Right-click and drag to pan the plot area.
Convert Pre-Defined Functions
When defining multipliers or P-Q curves, you can use pre-defined functions to help populate table data.
P-Q curves are used when defining fan components.
-
From the plot dialog, click the Function drop-down menu and select a function
type.

- Step

- Sds

- Single Wave

- Oscillating

- Swept Sine

- Impulse

- Ramp
-
Define the function parameters in the following ways:
- Enter values in the text boxes.
- Click and drag the grid lines in the plot area that correspond to the
function parameters.The grid lines that can be manipulated appear darker and are highlighted when hovered over.
Figure 3. 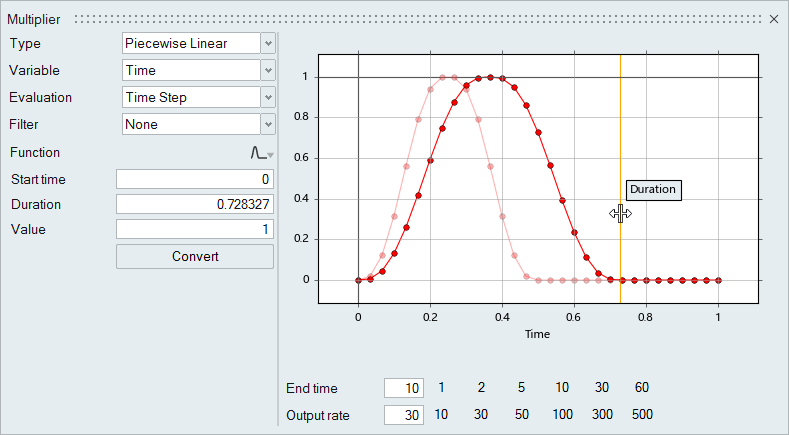
Note: Individual points cannot be repositioned when manipulating pre-defined functions. - Below the plot area, choose a defined end time and output rate or input
a value in the text box.Note: Only available for multipliers.
The plot and the function parameters dynamically update to reflect any changes. -
Click Convert.
The function data is converted to table format.
Once converted, you can edit the points in the table or drag points on the graph to further refine the data.