Efficiency map & temperature limits
In the current version, a powerful enhancement to the Efficiency Map Test is introduced: the integration of standard duty types and the corresponding thermal limit analysis.
This new feature brings together electromagnetic and thermal simulation by enabling users to visualize temperature maps over the entire operating range of a motor under standardized duty cycles (S1, S2, S3). The feature provides deep insight into the thermal limits of the machine that are critical for optimizing reliability, cooling strategies, and motor performance in real-world industrial applications.
- Standard Duty Cycle Integration: In addition to the user-defined S9 mode, users
can now select from three commonly used IEC-standard duty types:
- S1 (Continuous)
- S2 (Short-Time)
- S3 (Intermittent Periodic)
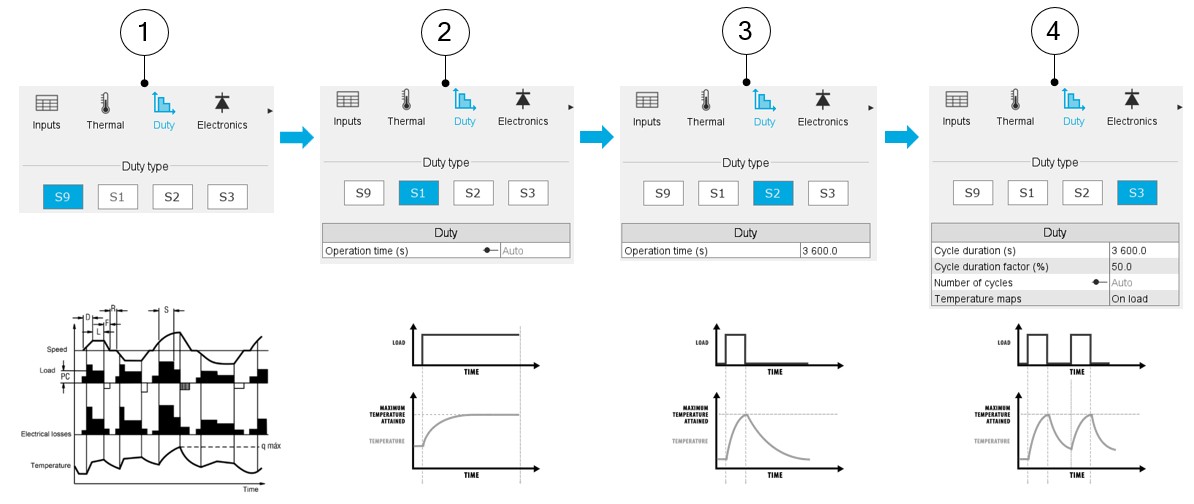
New Duty settings with the four choices S9, S1, S2, and S3 - Temperature Map Generation:
- For each torque-speed operating point, the motor is simulated under the chosen duty.
- At the end of the duty pattern, the steady-state or cycle-end temperature is recorded.
- A complete thermal map is produced, visualizing hot zones and thermal risks.
- Auto Mode Support:
- For S1 and S3, automatic cycle duration estimation is available based on the thermal time constant of the machine (typically 5× time constant), ensuring sufficient time to reach steady-state or periodic stability.
- Temperature Evolution Curves:
- Users can select any working point to plot temperature vs. time, enabling assessment of heating and cooling dynamics across different duty profiles.
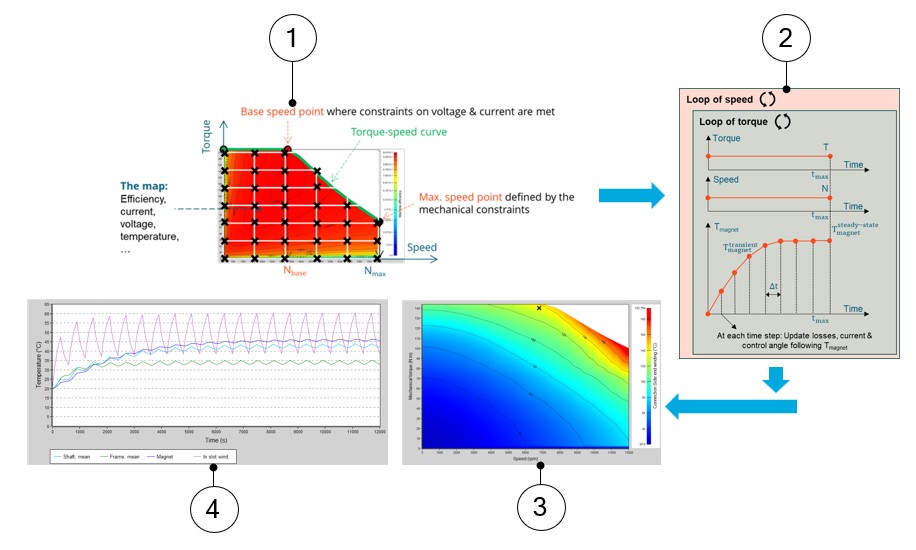
Workflow to include the temperature maps in the efficiency map test of SMPM 1 Electromagnetic computation to deduce the efficiency map test 2 Looping through all working points to find the machine temperature using selected duty (S1/S2/S3) 3 Collect temperature at all thermal nodes to display temperature maps with contours 4 Run a final duty computation to analyze the time evolution of temperatures at a specific working point required by users - Flexible Input & Familiar Workflow:
- The same torque-speed input table is retained for ease of use.
- Clear configuration path: enable/disable thermal coupling, select duty
type, and adjust thermal components with intuitive inputs.
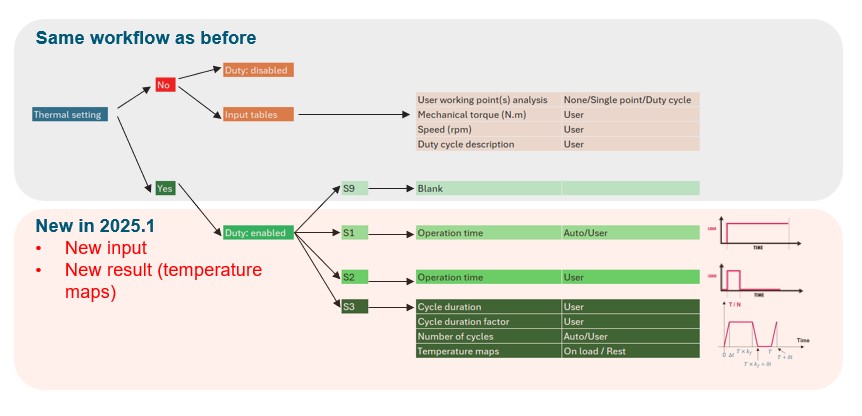
Flexible input & familiar workflow even with the added features
- Thermal Class & Design Decisions:
- Temperature maps support direct comparison with winding thermal classes.
- Users can quickly identify if a winding upgrade or cooling system modification is required to meet performance goals.
In terms of performance and computation time, here below is a list of rules of thumb:
- Computation time is influenced only by the thermal simulation layer.
- On average, each temperature point requires ~3 seconds to compute.
- Total time = (torque points x 2 × speed points × 3 seconds).
- Default configurations typically run in 10–12 minutes, with faster or more
detailed options available via grid refinement.
With these new features, users can have a lot of benefits, such as:
- Early detection of thermal risks and temperature hotspots
- Faster decision-making regarding thermal class and cooling strategies
- Improved accuracy in motor dimensioning under real-world operating profiles
- Optimized design without excessive prototyping or late-stage thermal surprises
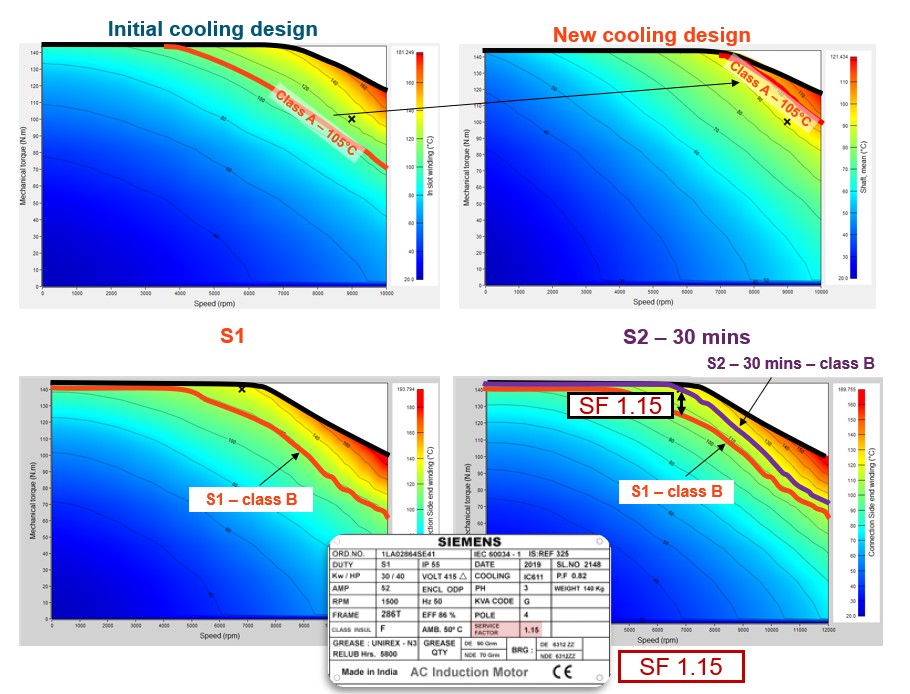
Applications of the temperature maps: adjusting thermal class, cooling system or exploring service factor This feature is available for SMPM in FluxMotor 2025.1. Expansion to additional motor types is planned in future releases, alongside ongoing GUI improvements and visualization tools for thermal data.