
Register One Job from the Command Line
To register a job with FlowTracer so that the inputs and outputs will be dynamically discovered as the job runs (known as runtime tracing), it is necessary to define the job by way of a wrapper program. In this section of the tutorial, we are registering jobs with FlowTracer interactively, from the command line.
At the command line, the program vwis the wrapper to register a job. vwis a program that takes a parameter that is the command line defining the job.
Usage: vw <command line that runs a job> % vw clang myprogram.cBy using the vw wrapper, runtime tracing of the job is established as it is added to the flow. runtime tracing is the feature of FlowTracer where it discovers and notices the resulting output file myprogam.o without you having to mention it in the command line, and without you having to explicitly tell FlowTracer about it. It can do this because the job is run within a wrapper that checks for implicit inputs and outputs used at runtime, and tells FlowTracer about them.
For this tutorial, you will be using cp as our emulation tool and using a file named "aa" as the primary input file. You must create a primary input file for our emulation. Do this command to create an empty file "aa" which will be our primary input file.
-
You must create a primary input file for the emulation. Do this command to
create an empty file "aa" which will be your primary input
file.
% touch aa
cp aa bb-
Do the command below to register this job, by calling the vw
wrapper program and passing it the command of the job.
% vw cp aa bbThis registers the job with FlowTracer. FlowTracer then runs the job. When it executes, the wrapper sends messages to the FlowTracer server describing the inputs and outputs of the program cp. As the job runs, you will see activity in the Set Viewer. Make sure to be looking at the set.Figure 1. 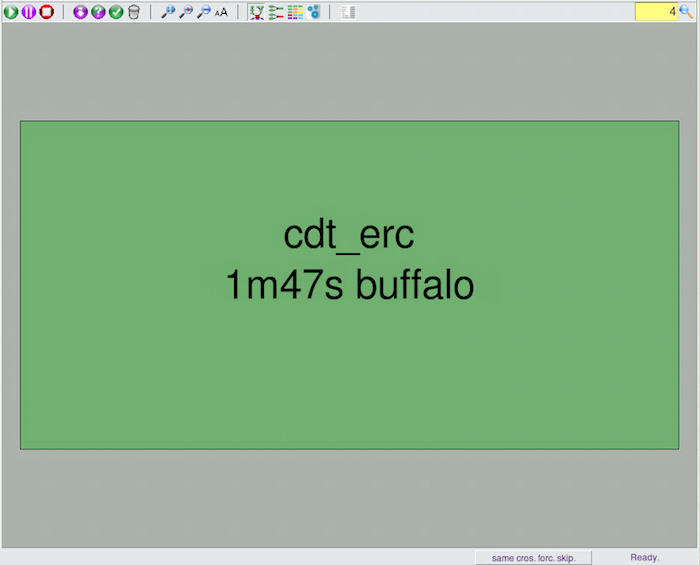
You will see a graph such as the one above. This shows the job node as a single green rectangle. You can see the number "4" in the upper right of the Set Viewer. This is reporting on the number of nodes in the set on display. The file nodes are not on display.
-
To turn on the display of file nodes, right click in the background of the
Set Viewer and click
Show/Hide to open a submenu where you can toggle on
the Show Files option.
Figure 2. 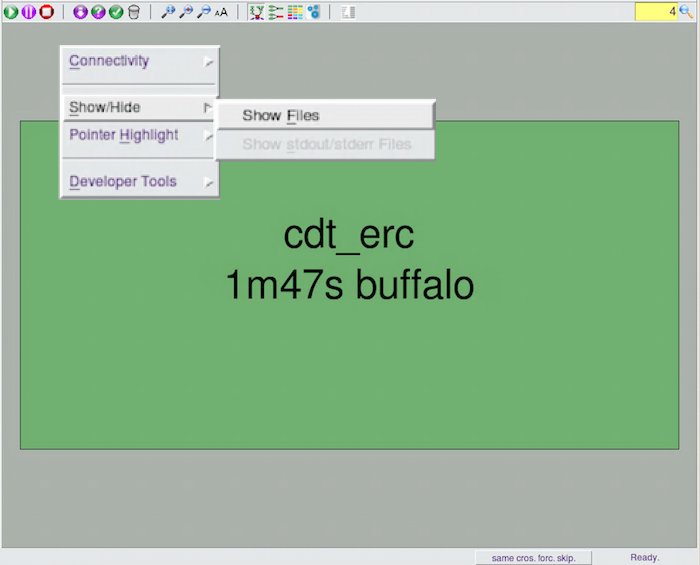
After turning on the display of file nodes, you will see the four nodes in the flow graph. This represents the dependency graph that is now encoded into FlowTracer's flow.Figure 3. 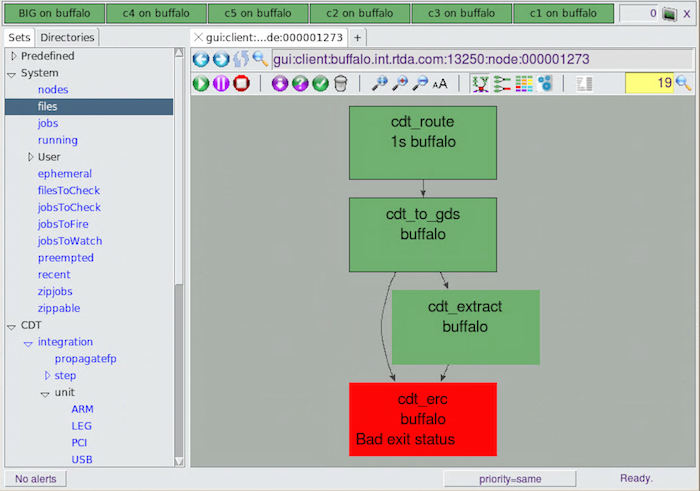
Note: If your display is not showing up completely within the Set Viewer pane, you can fit the graph to the available area by clicking on to
fit the view.
to
fit the view. -
Repeat the registering of the cp command if you missed
seeing the changes to the display as it ran.
% vw cp aa bb
% vw cp aa bb
This appears to register the job again. But because the command is the same string, and we are in the same directory, it is recognized as the same job as an existing job, and a new job is not created.The circles represent files, the rectangle represents a job, in this case the job of copying file aa to file bb. The arcs represent the input/output relationships between files and jobs.
The green color means that the files and the jobs are up-to-date.
In this case, there is one input file "aa" and one output file "bb". Depending on your setup, you may get additional inputs, such as the file "cp".
This "cp" file exists as an input in the dependency graph because the program cp is a dependent element of the task. If the version of the program changes, then the result of the task could be different. This was noted by FlowTracer even though we did not explicitly tell FlowTracer about this dependency. This is an example of FlowTracer performing runtime tracing to figure out all the dependencies, even if you do not register them fully.
In production you can exclude program files from the graph. For this tutorial, you will see that "cp" input file as a dependency node. All the circles and the rectangle should be green at this point, meaning that they are all up-to-date, or, "VALID".