Train
Train models based on the dataset.
The model will be built using the collected data to predict outputs real-time value.
-
Click Next to view the Data Summary and Variable
Ranking.
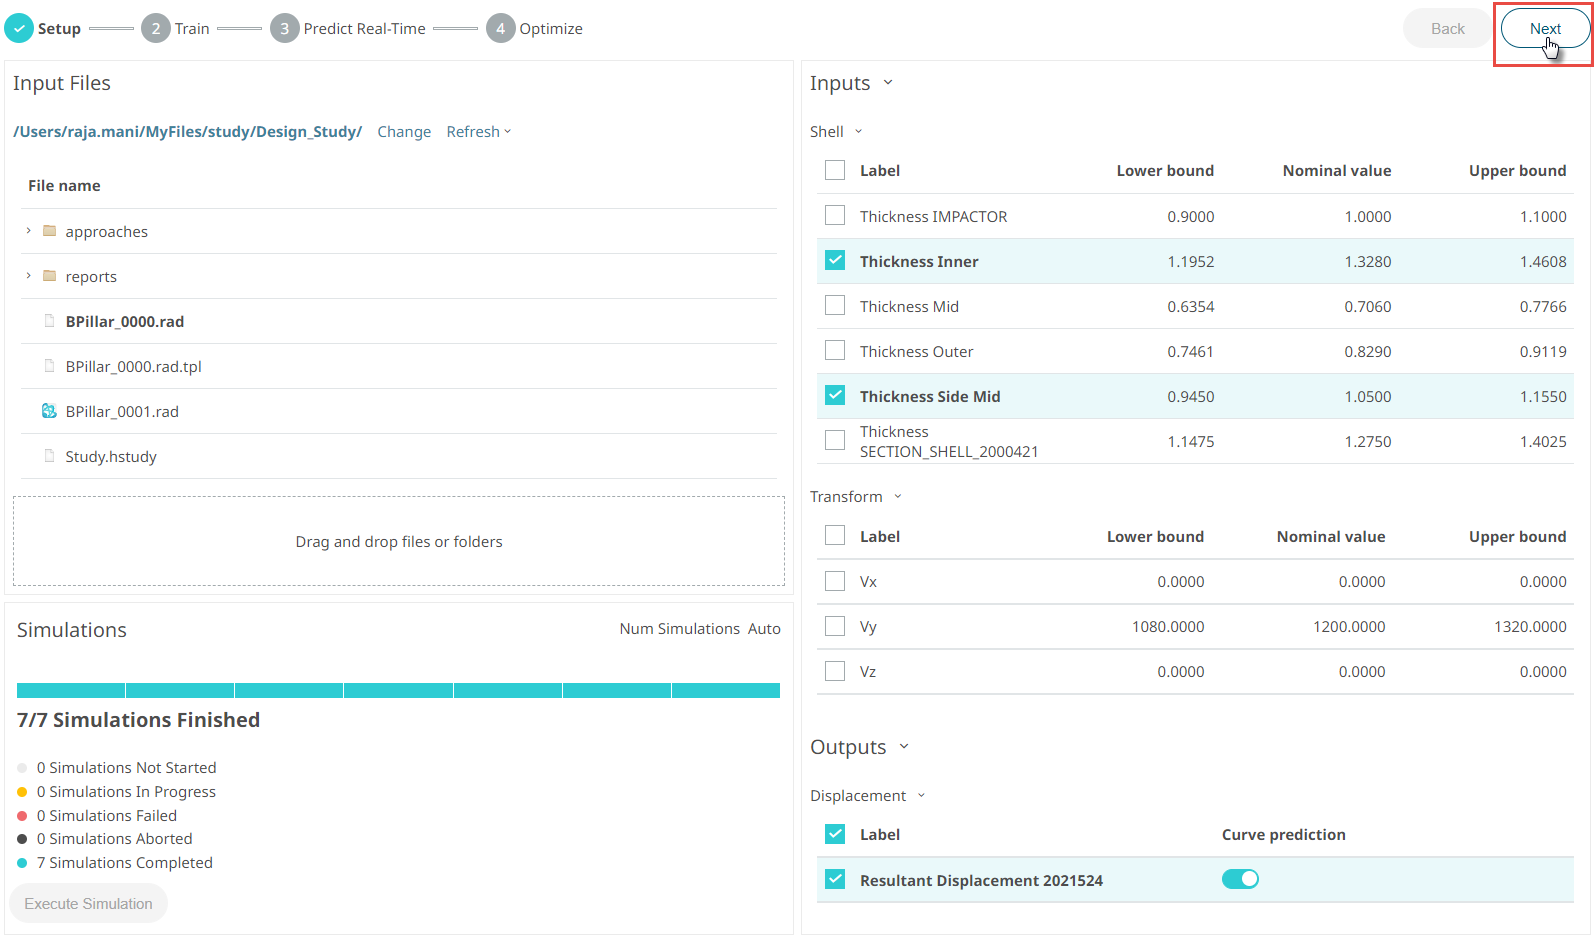
Figure 1. TrainThe Data Summary is displayed.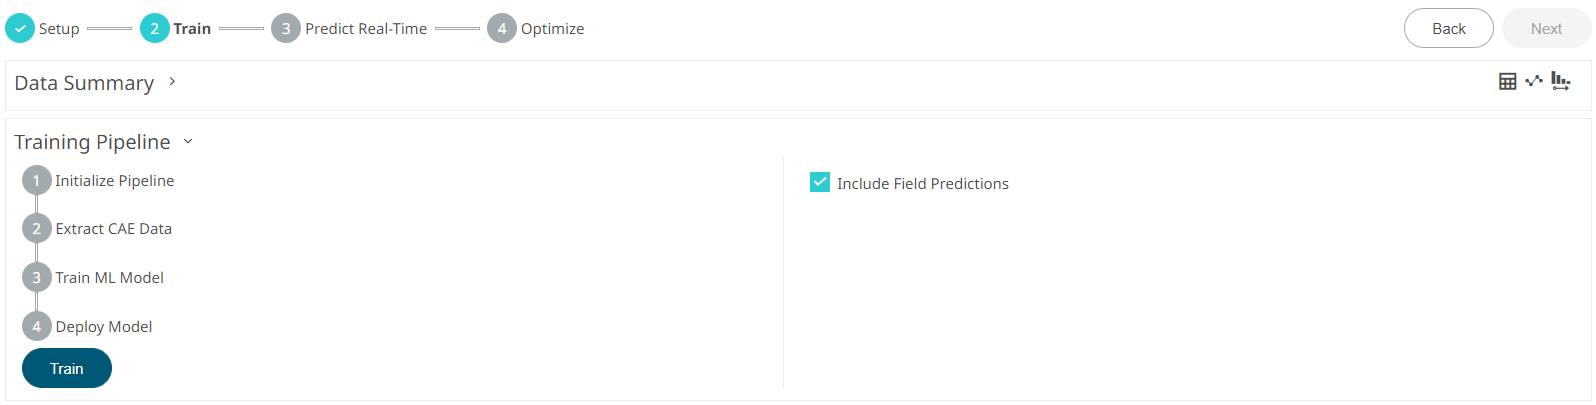
Figure 2. Data Summary -
Click
 next to Data
Summary to view the details.
next to Data
Summary to view the details.
 Figure 3. Data Summary InformationData summary of the model is displayed in the table view.
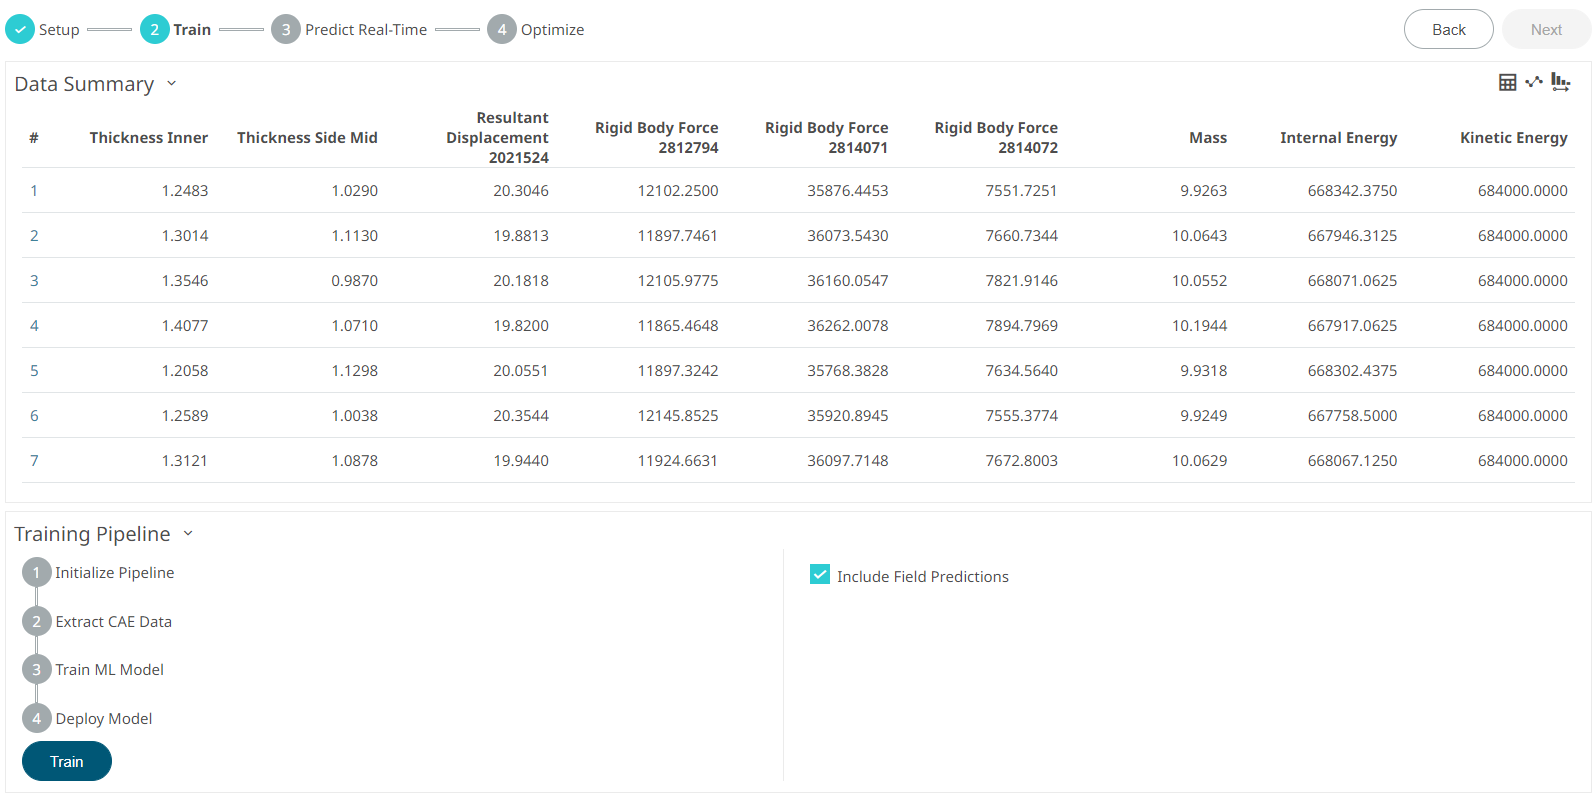 Figure 4. Data Summary in Table View
The Data Summary displays the simulated values of the input and the corresponding output values. The Data Summary values are displayed in Table View (
 ), in Parallel Axis View (
 ), and in Pareto View (
 ). By default, it is displayed in table
view.Note: Toggle between the table view, parallel axis view, and pareto view by clicking, , and respectively.
). By default, it is displayed in table
view.Note: Toggle between the table view, parallel axis view, and pareto view by clicking, , and respectively.By default, the Include Field Predictions is selected which provides the complete H3D model displacements and the stress values.
-
Click for the parallel axis view.

Figure 5. Data Summary in Parallel Axis View -
Click-and-drag your mouse to draw a line around sets of lines.
For example, draw a line at Thickness Slide Mid and Rigid Body Force 2814072. Click the line to remove it.
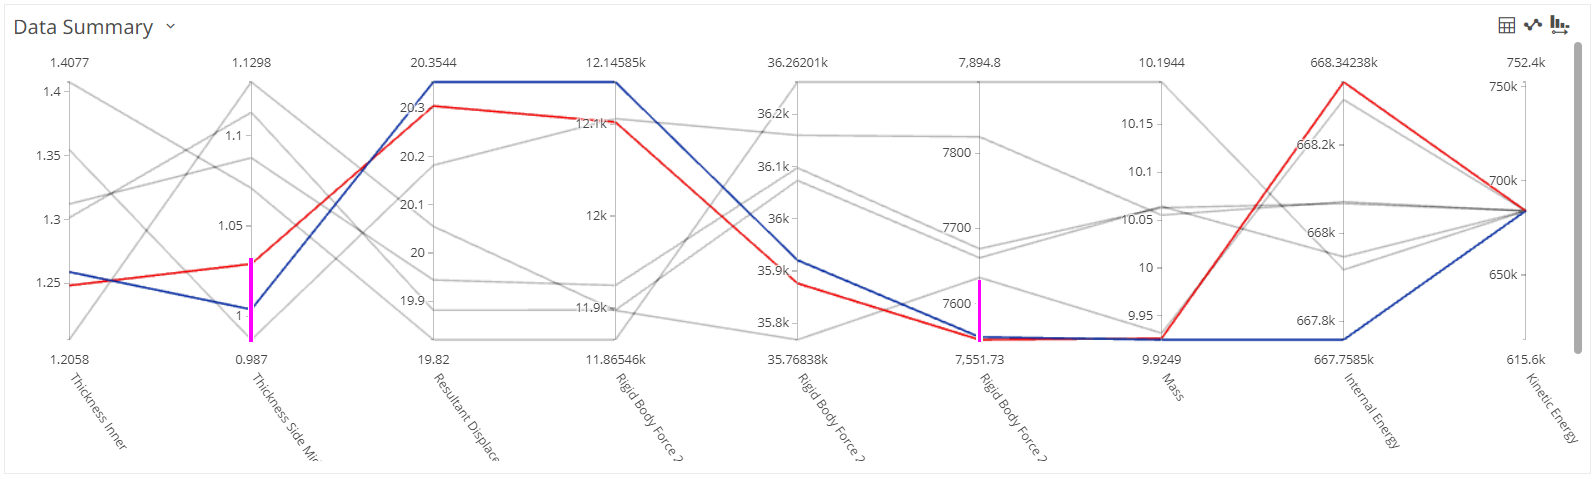
Figure 6. Data Summary Chart ValueAll the data points in the chart that is included in the drawn lines will remain displayed, while unselected lines disappear. A visual indicator appears and displays the minimum and maximum values for the selected set of lines.
-
Click for the pareto view.

Figure 7. Pareto ViewThe Pareto view displays the linear effects of inputs on the selected output in hierarchical order. X-axis is inputs and y-axis is the linear effect of the input on the selected output. Inputs that have positive effect on the selected output have bars on the positive y-axis. Inputs that has negative effect on the selected output have bars on the negative y-axis. Select the other outputs legends to view the corresponding linear effects.
-
Double-click a legend to view linear effects of the outputs.

Figure 8. Pareto View of all the OutputNote: Double-click a legend to return to the previous view of a single linear effects. -
Click Train.
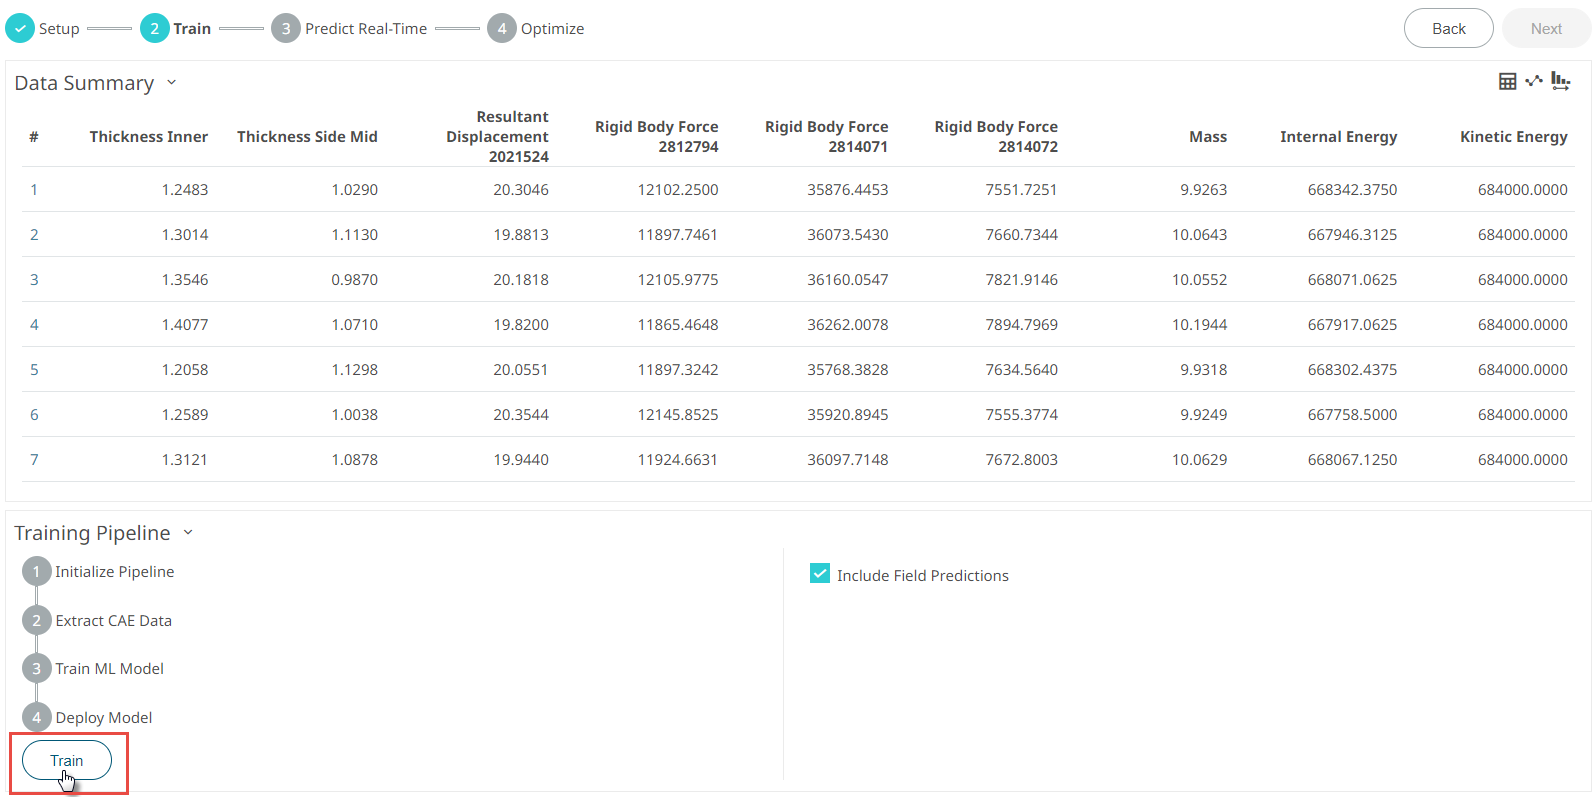
Figure 9. Train ModelsThe Training Pipeline displays the different stages the model are trained. Multiple models are trained in the background with different settings and the best one is used in the next step-Predict Real Time.