Optimization
Perform an optimization by updating the input value goals and setting the minimum and maximum values.
An Optimization is a mathematical procedure used to determine the best design for a set of given constraints, by changing the input variables in an automatic manner.
Typically, Optimization can be used to reduce product weight, improve performance, and meet design targets.
Input variables, objectives and constraints need to be defined in order to formulate a design problem as an optimization problem. There can be a single or multiple objectives. Furthermore, problems can be either deterministic or probabilistic, where the objective is to meet a certain reliability and robustness target.
Optimization uses the predicted model values. In Predict Real-Time, you set the design variables to get the responses. In Optimization, you set the requirements for the responses to get the design variable values that will meet that.
If the optimization does not meet your expectations, then change the requirements of the response and run the optimization to get the optimal values.
- Optimum - The point or design that minimized (maximized) the objective function and at the same time satisfy all the constraints.
- Violated - Constraint that is not satisfied.
- Active - Constraint that is satisfied exactly; equality constraints are active for feasible designs.
- Inactive - Constraint that satisfied but not on the bound.
- Feasible - A point or a design that satisfies all the constraints.
- Infeasible - A design that violates one or more constraints.
-
Click Next to optimize the design study.
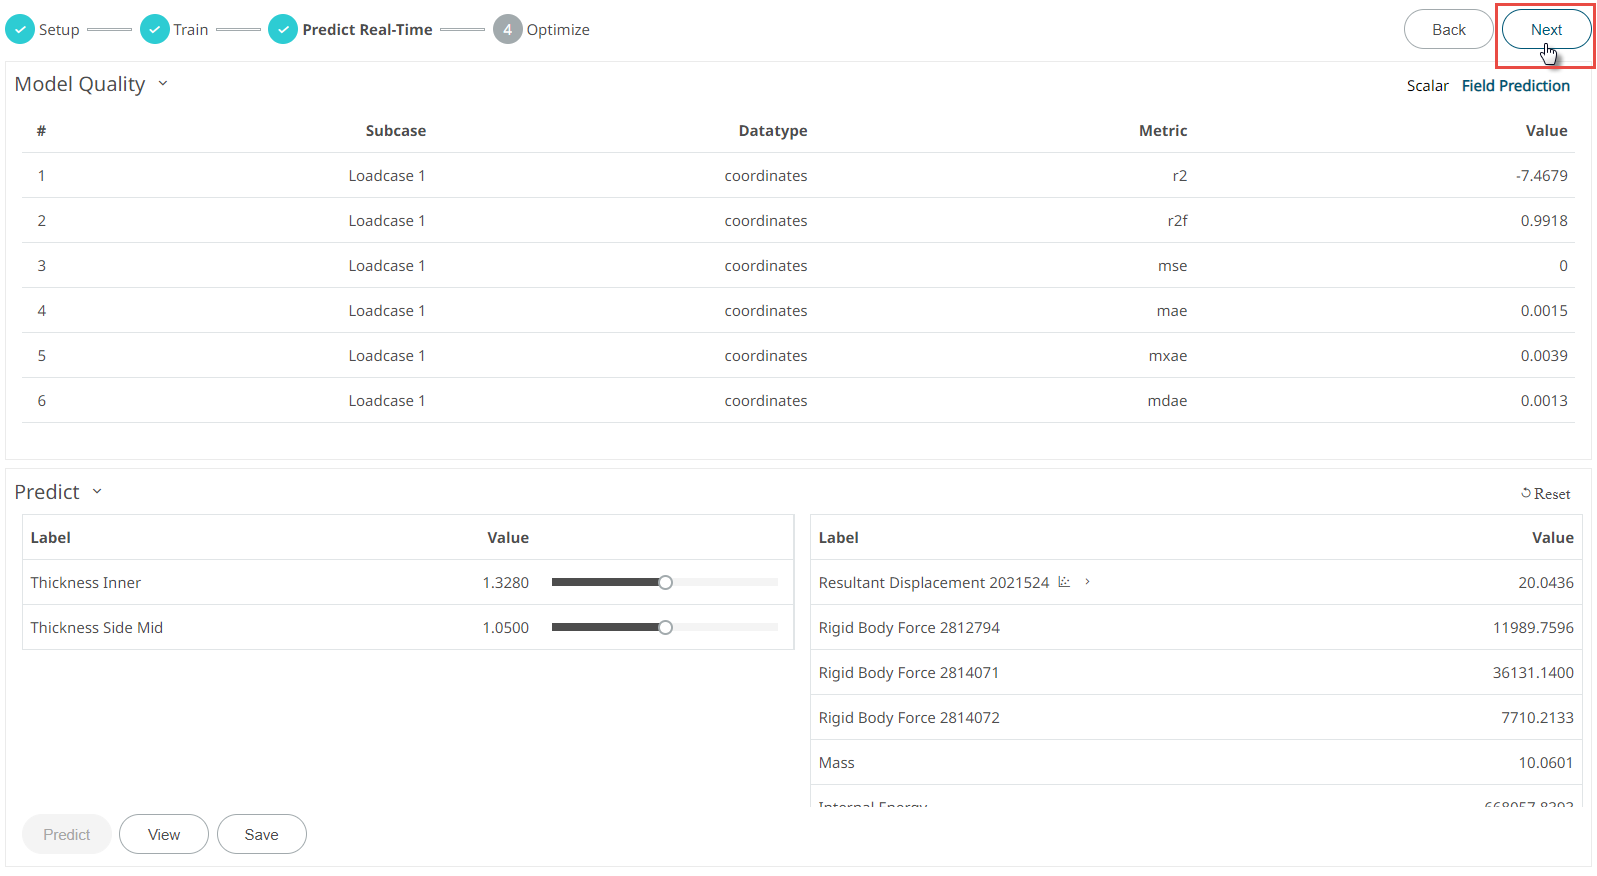
Figure 1. OptimizeThe Optimize goal list is displayed.
Figure 2. Optimize Goal -
Select the objective goal from the drop-down list for the output label.
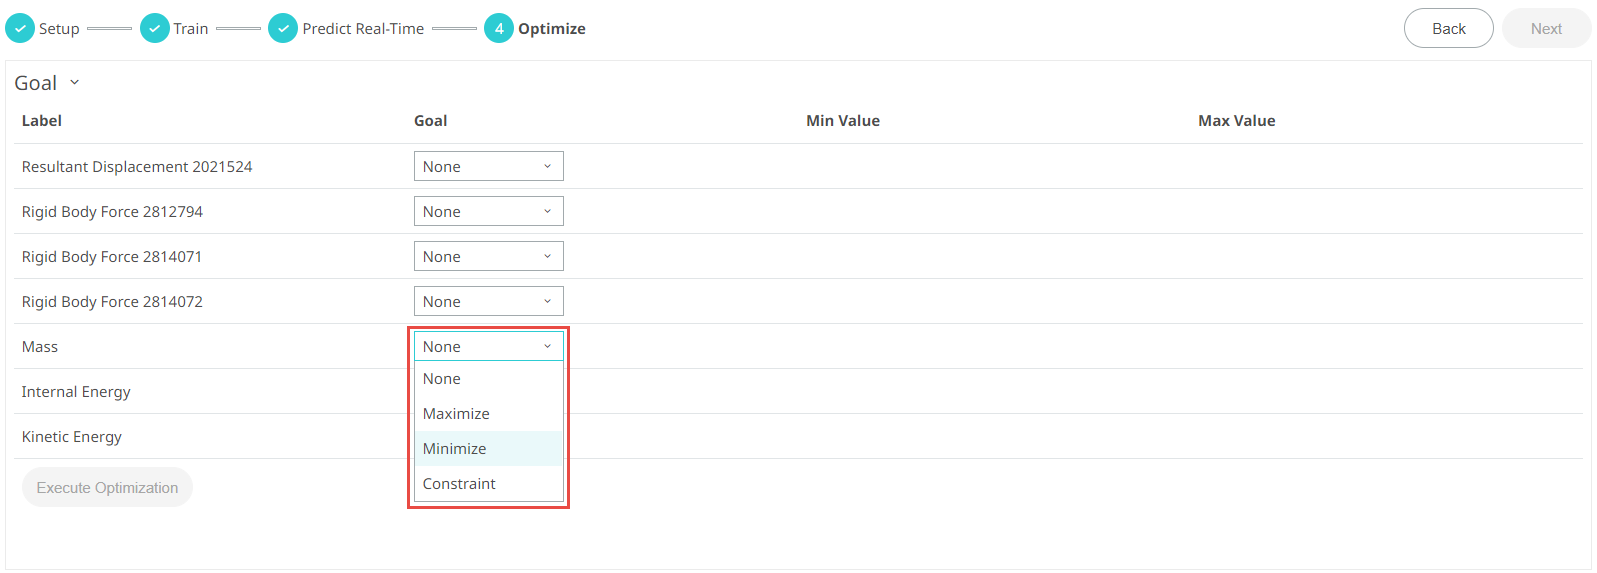
Figure 3. Optimize Goal SelectionBy default, the goal is set to None for all the responses. The following are the options that can be set as a goal for the responses:- Maximize
- Minimize
- Constraint
To run the optimization, set a single goal.
Figure 4. Optimize - Goal Set -
Click Execute optimization to optimize the design study
based on the goals that is set.

Figure 5. Execute OptimizationOptimization is performed and the results are displayed.
Figure 6. Optimization ResultThe Optimization Results values are displayed in Table View (
 ) and in Graph View (
 ). By default, it is displayed in table view.
Toggle between the table view and graph view by clicking and respectively.
). By default, it is displayed in table view.
Toggle between the table view and graph view by clicking and respectively.The Optimization Results table provides the iteration values, Condition and Best Iteration.
-
Click to view the graph of the optimization
result for each of the reference.
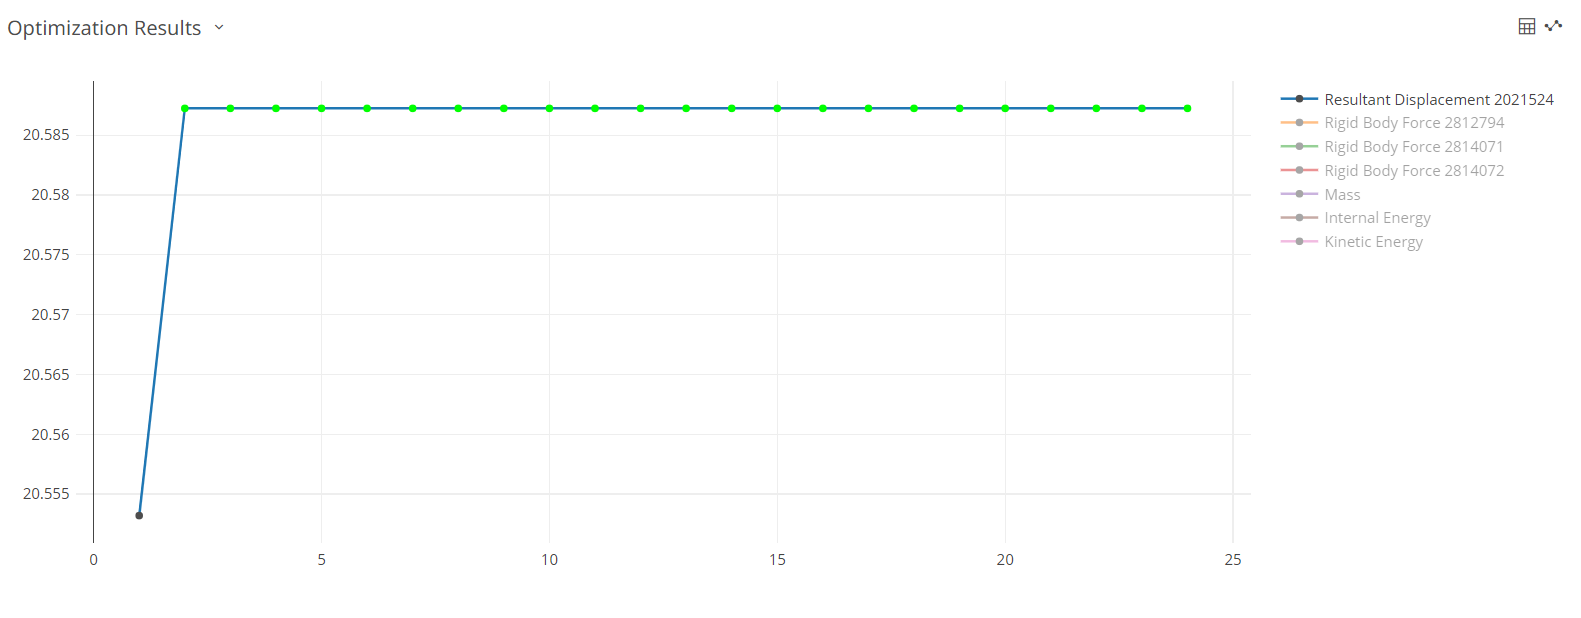
Figure 7. Optimization Results - Chart View -
Click the output legends to view its corresponding chart.

Figure 8. Optimization Results - Chart View, Mass -
Click-and-drag your mouse to draw boxes around set of values.

Figure 9. Mass Chart View - Select ValuesAll the values included in the box remain displayed, while unselected values disappear. A visual indicator appears and displays the minimum and maximum values for the selected set of values.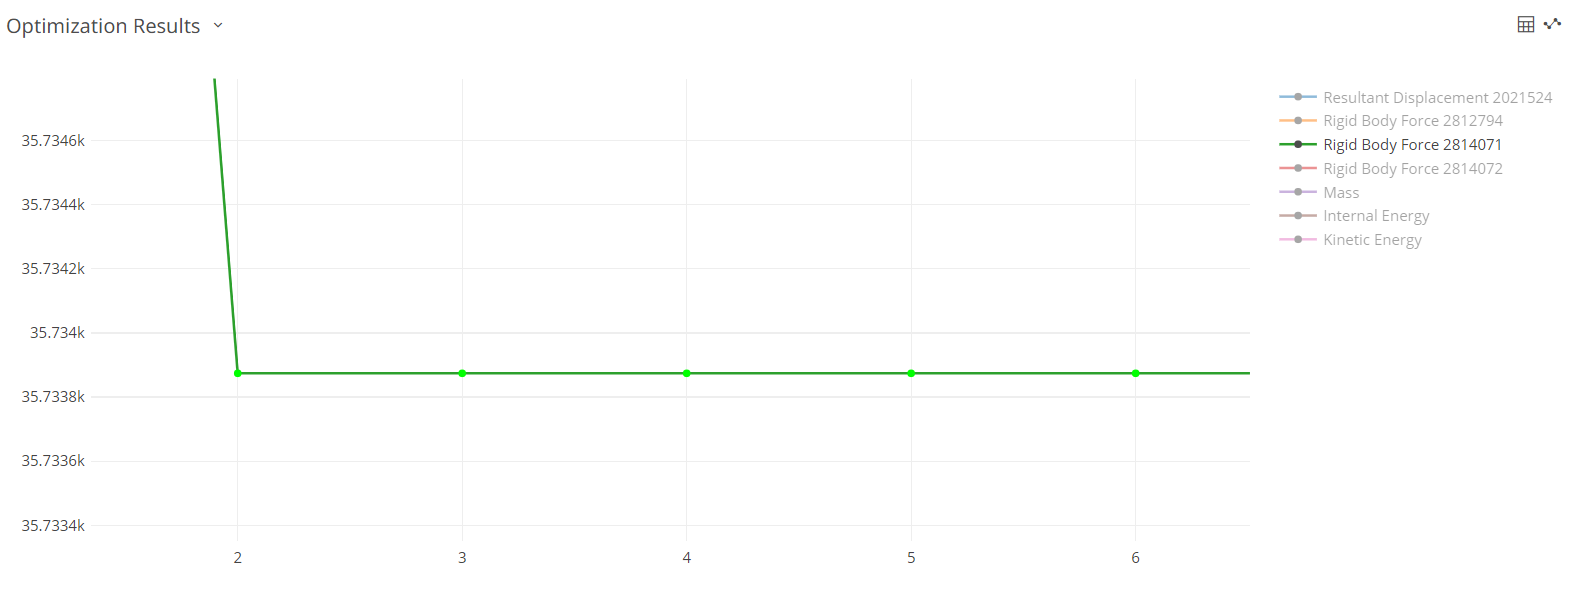
Figure 10. Mass Chart View - Selected ValuesNote: Double-click the chart to return to the previous view of the chart. -
Change the goal value if the optimization does not meet your
expectations.
The following message will be displayed to purge the optimization results:

Figure 11. Purge Study Result Confirmation