
Create a Dashboard Using the Altair IoT Studio Write Connector
This connector allows you to make HTTP requests to communicate with AnythingDB from Panopticon so that you can, for example, update information for the Things in AnythingDB.
Important: To visualize data stored at the Properties History section in
AnythingDB, or the data stored in a Category, you will first need to create an App.
-
Click and create a new App by following these steps.
Note: The Application Client ID and Secret ID is required in configuring the New Workbook in Real time Visualization module. Be sure to capture and save this information.Note: The App should have Thing as Scope and the type set as Client Credentials. Don't forget to set the authorization by adding a role or some policies.
- Click .
-
Select a folder to work in. By default a root folder with your username has
been created. Right click to see the different operations you can perform.
Figure 1. 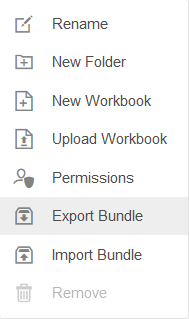
- Click New Workbook.
-
Enter a name for the Workbook and click Create.
Figure 2. 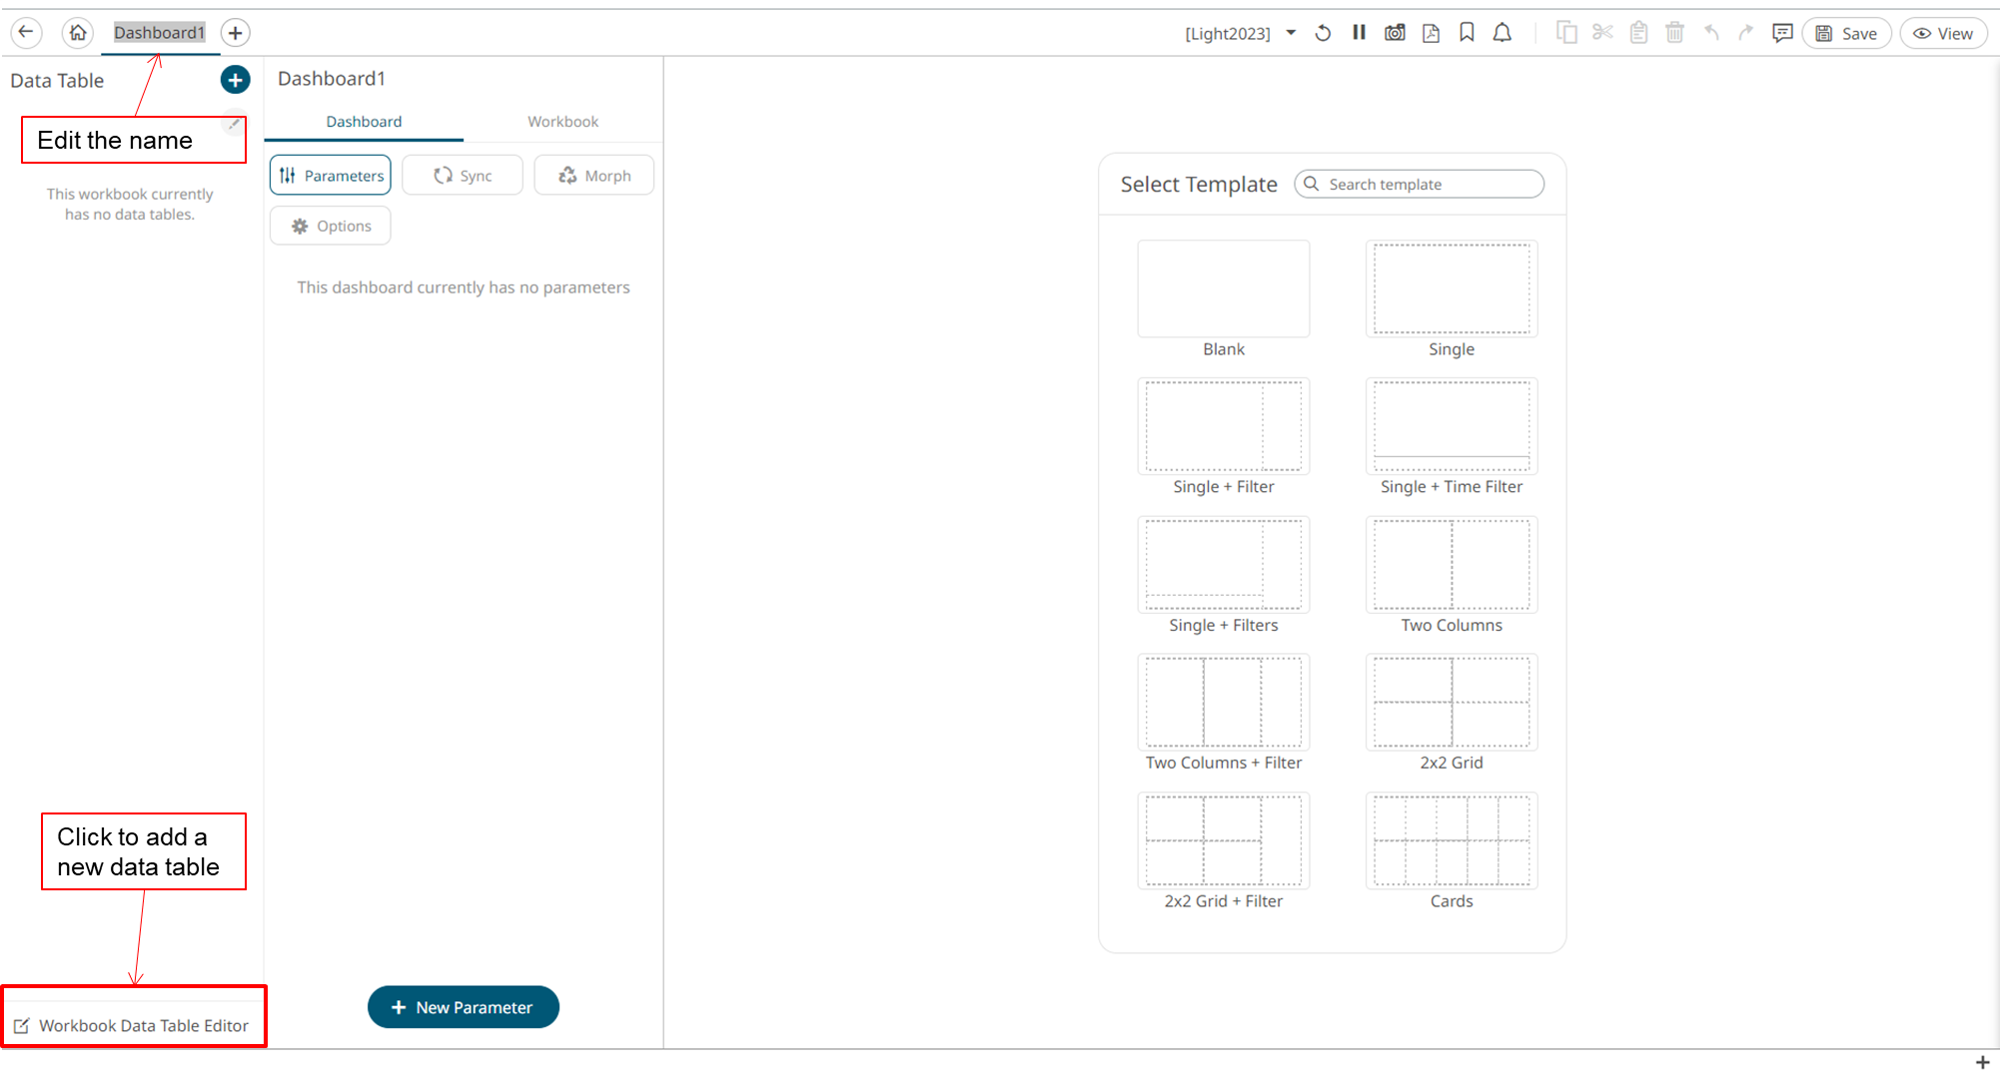
-
Add a new Data Table by clicking Workbook Data table
editor in the lower left corner.
Figure 3. 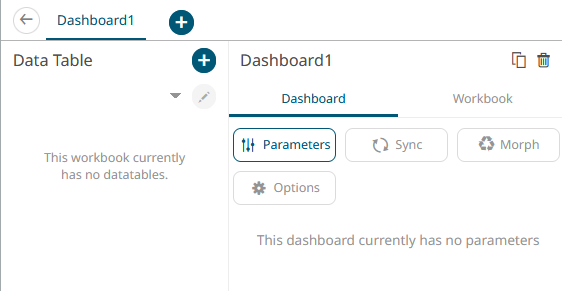
-
Create a Data Table by clicking the + icon.
Data tables define the queries and source data repository definitions, in order to retrieve data.
Figure 4. 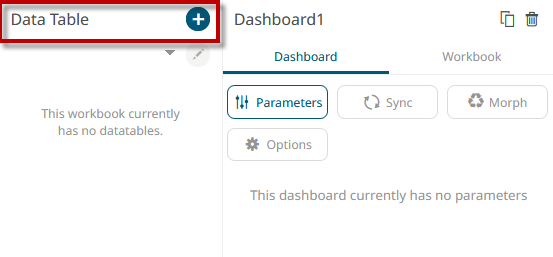
- With Data Sources highlighted, under File/URL, select Altair IoT Studio Write.
-
Enter the following:
- Client ID: from the App created in Step 1
- Client Secret: from the App created in Step 1
- Grant Type: type of App created in Step 1. Here we use client_credentials.
- Scope: from the App created (thing)
The information needed to complete the following fields can be found here.
- URL: to make the request.
- HTTP method: Choose from the drop-down menu
- Request body
- Click Save.
- Click Back to return to the Edit Dashboard view.
-
On the blank canvas (right half section), sketch a simple square by clicking
and dragging on the blank interface.
This enables the Visualization menu.
Figure 5. 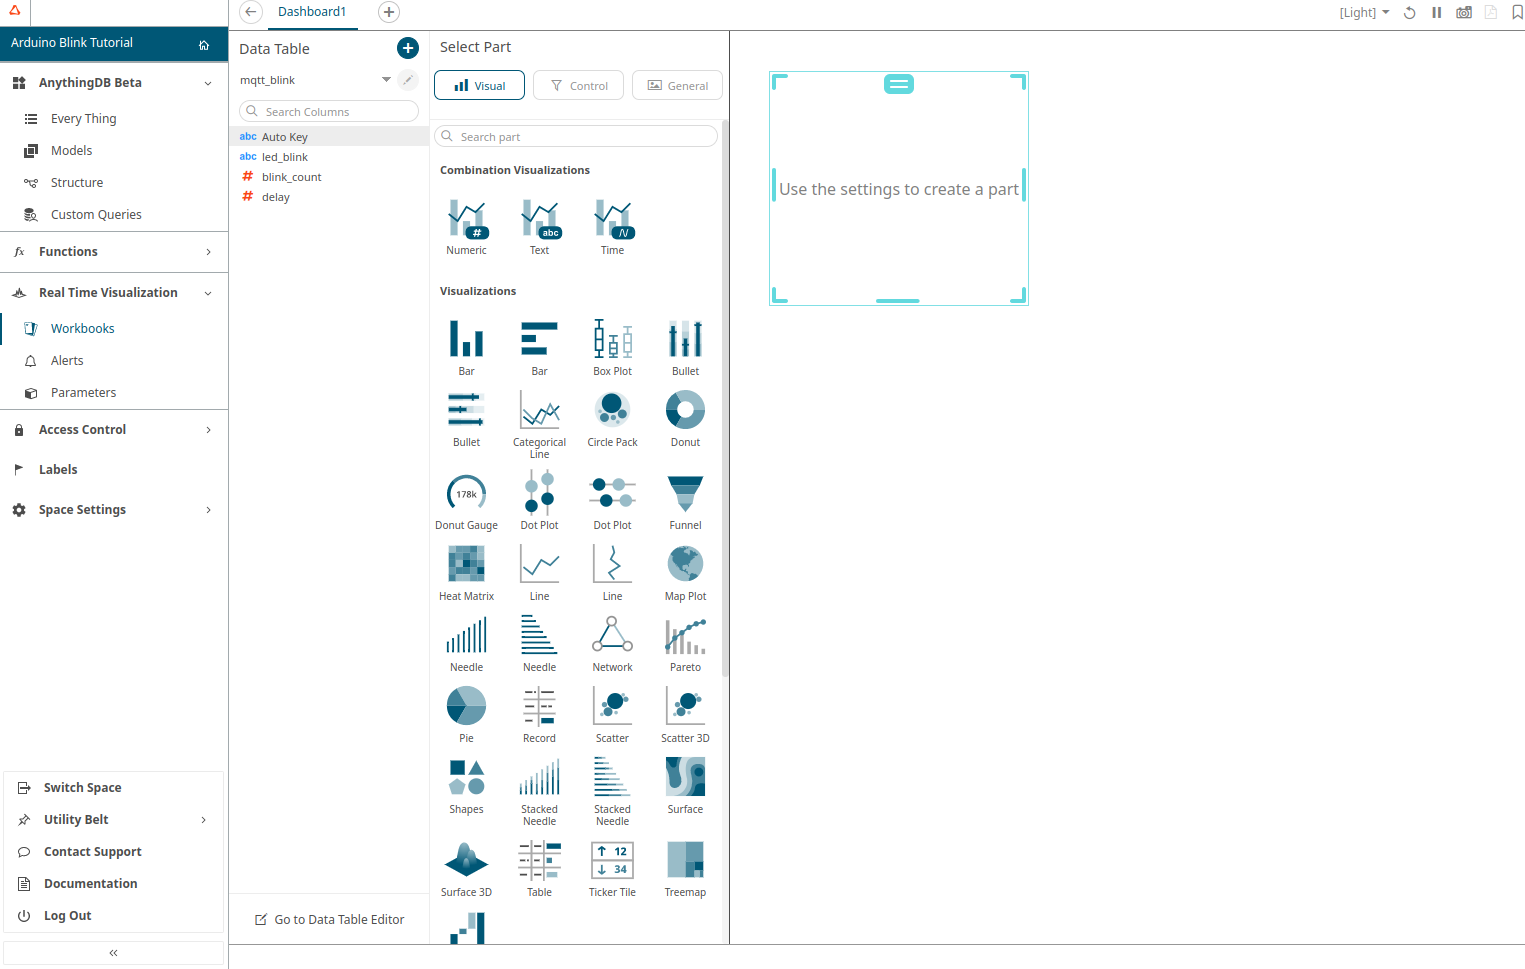
-
Select the Visualization mode and configure it using the Visualization
settings.
Detailed information regarding Data Tables is available from the Panopticon Designer documentation.