
Create a Dashboard Using the Altair IoT Studio Connector
This connector enables you to retrieve the data stored in AnythingDB.
Important: To visualize data stored at the Properties-History section in
AnythingDB, or the data stored in a Category, you will first need to create an
App.
-
Click and create a new App by following these steps.
Note: The Application Client ID and Secret ID is required in configuring the New Workbook in Real time Visualization module. Be sure to capture and save this information.Note: The App should have Thing as Scope and the type set as Client Credentials. Don't forget to set the authorization by adding a role or some policies.
- Click .
-
Select a folder to work in. By default a root folder with your username has
been created. Right click to see the different operations you can perform.
Figure 1. 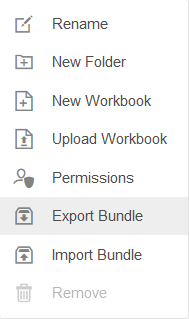
- Click New Workbook.
-
Enter a name for the Workbook and click Create.
Figure 2. 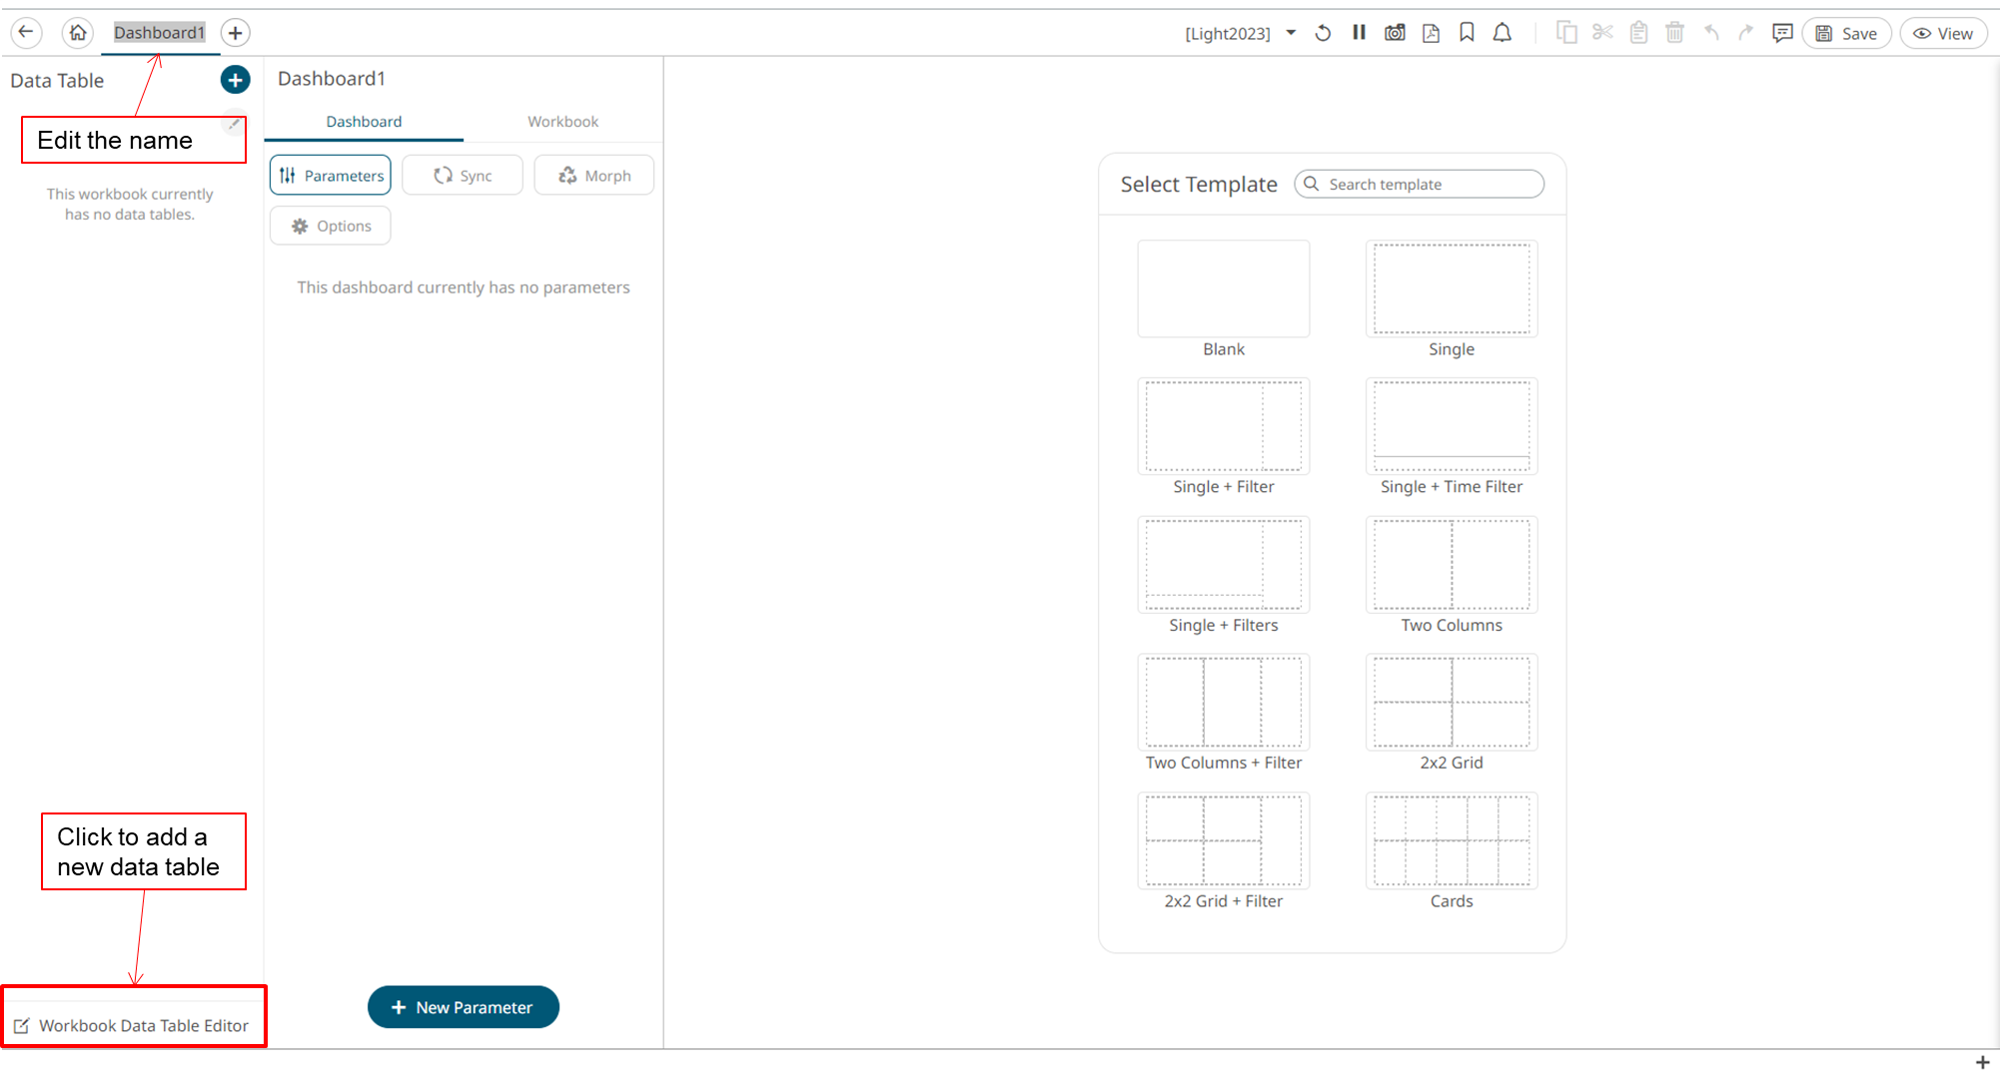
-
Add a new Data Table by clicking Workbook Data table
editor in the lower left corner.
Figure 3. 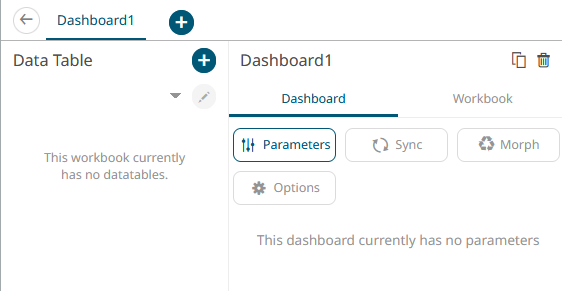
-
Create a Data Table by clicking the + icon.
Data tables define the queries and source data repository definitions, in order to retrieve data.
- With Data Sources highlighted, under File/URL, select Altair IoT Studio.
-
From the list, choose type of operation to perform:
- Get the status of all the Things from a Category
- Get properties values of a specific Thing
- Get historical values of all the properties of a specific Thing
- Manage data through HTTP
- Run a custom query
-
Complete the information under the Connection section:
- Space ID: from your workspace
- Client ID: from the app created in Step 1
- Client Secret: from the app created in Step 1
- Timout: Default is 10, but it can be increased
- Category name
- Thing ID
Note: The scope, Url and record path are automatically populated. A request body can be added if needed.Figure 4. 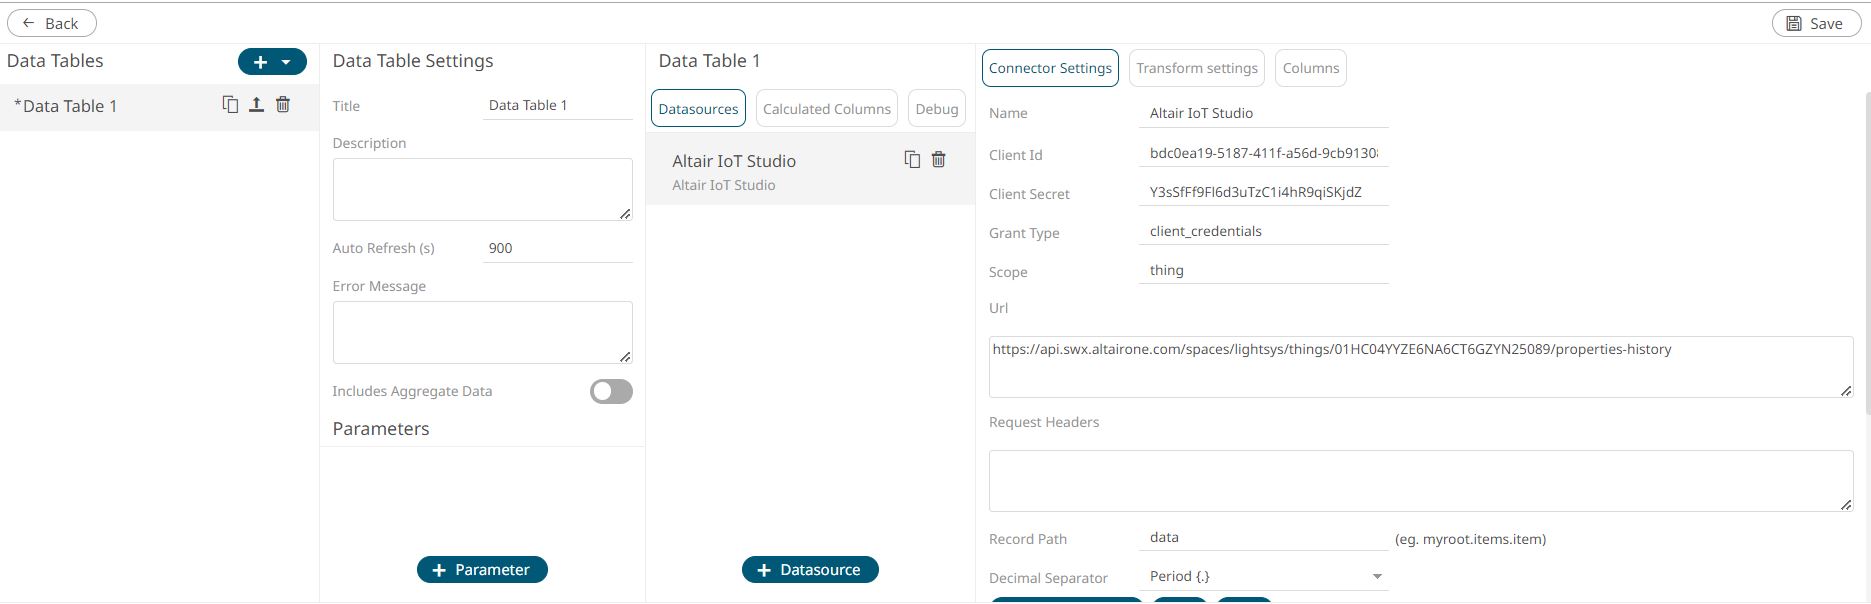
-
Click Generate Columns, and then click
Refresh Preview.
The columns are populated and the requested data is displayed.Tip: If something is not working as expected, click Test in the Test Connection section.
- Click Save.
-
Click Back to return to the Edit Dashboard view.
Figure 5. 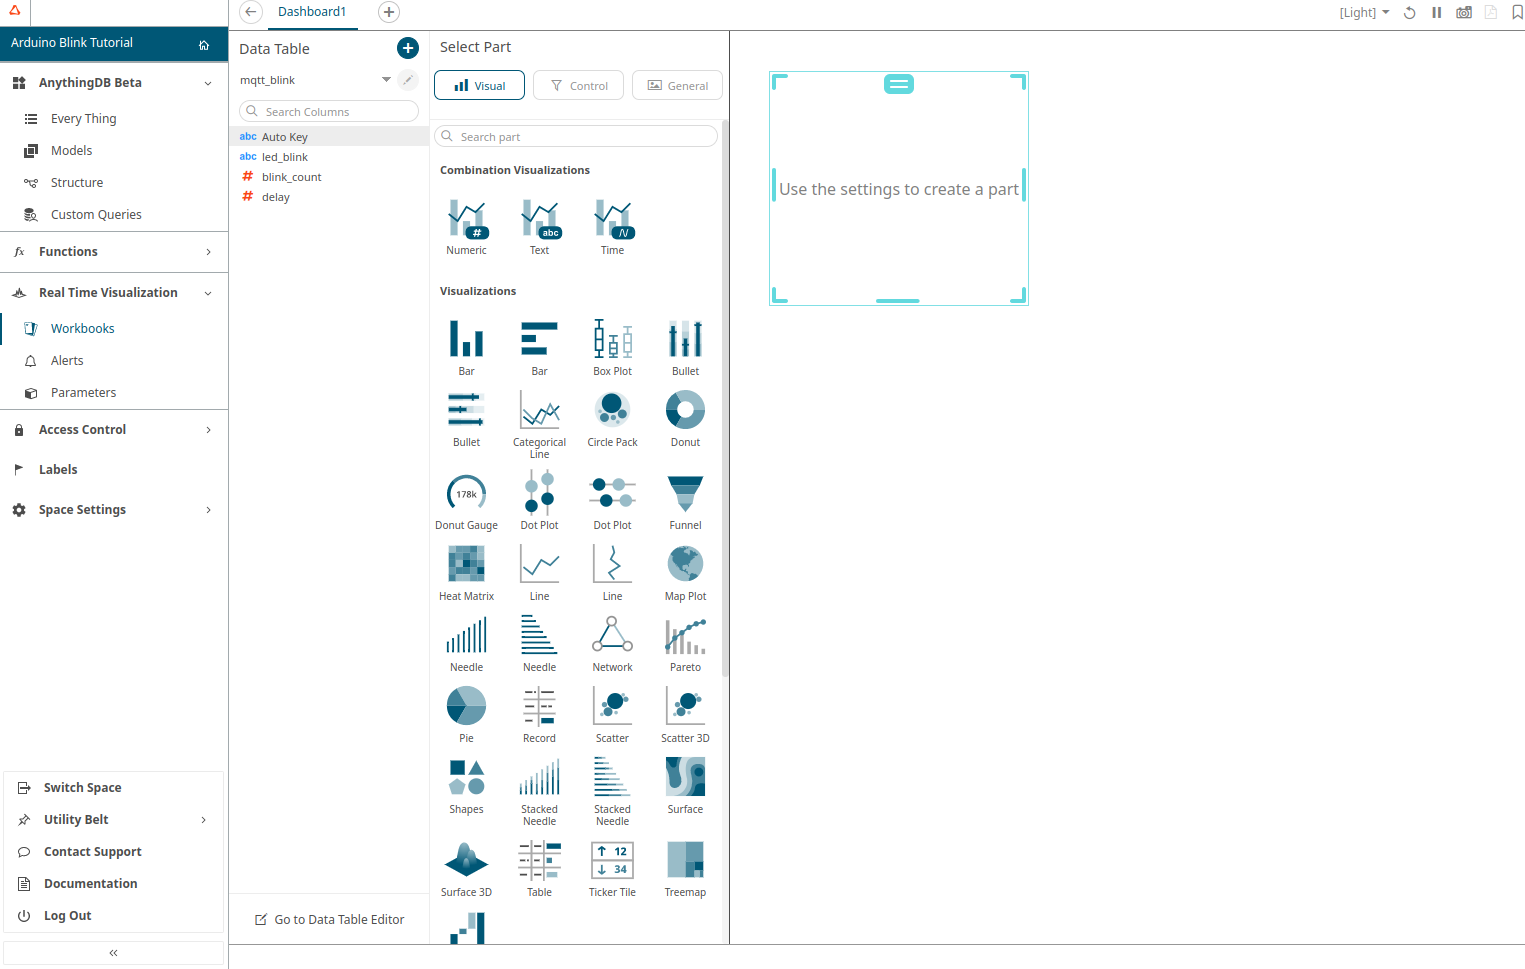
-
On the blank canvas (right half section), sketch a simple square by clicking
and dragging on the blank interface.
This enables the Visualization menu.
-
Select the Visualization mode and configure it using the Visualization
settings.
Detailed information regarding Data Tables is available from the Panopticon Designer documentation.