Block Diagram
Visualize process and its data flow via blocks.

Figure 1.
Each task can be executed with or without any user interaction, for example, in batch mode. A collection of tasks can be grouped into a solution or automation. A collection of tasks and solutions/automations is called Process.
Tasks are mainly defined by executing a specified script with a specified application, defining what the script needs as input from you or prior scripts and what output the script produces. The process of Dataflow, Input, and Output are controlled by Variables and Dataflow.
ScriptDemo1.py script
in SimLab which requires you to select the Geometry File
(input) from the file explorer and enter an element size. Depending on the input, it
will mesh the geometry and export a Solver Deck, Output File.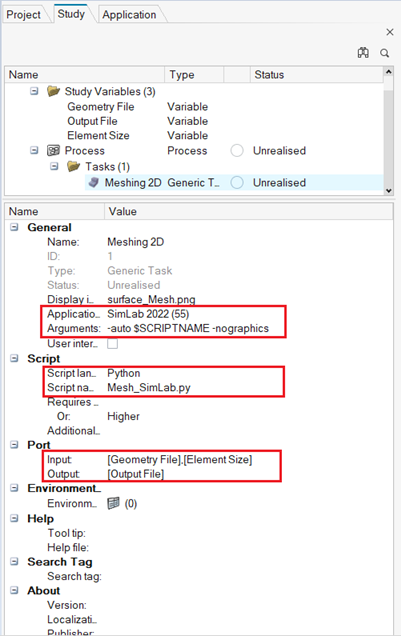
Figure 2.
Each task can have multiple input and outputs to control variable data flow. Read more about it in Variables and Dataflow.