Coupling Charts
The options "Coupling by Frequency", "Coupling by Step" and "Coupling by Speed" under the Results -> Coupling menu allow the user to analyze the dependency the coupling values have with the frequency, the geometry and the speed of sound, respectively, while keeping the other parameters constant. When selecting one of these options, a panel like the following will be shown:
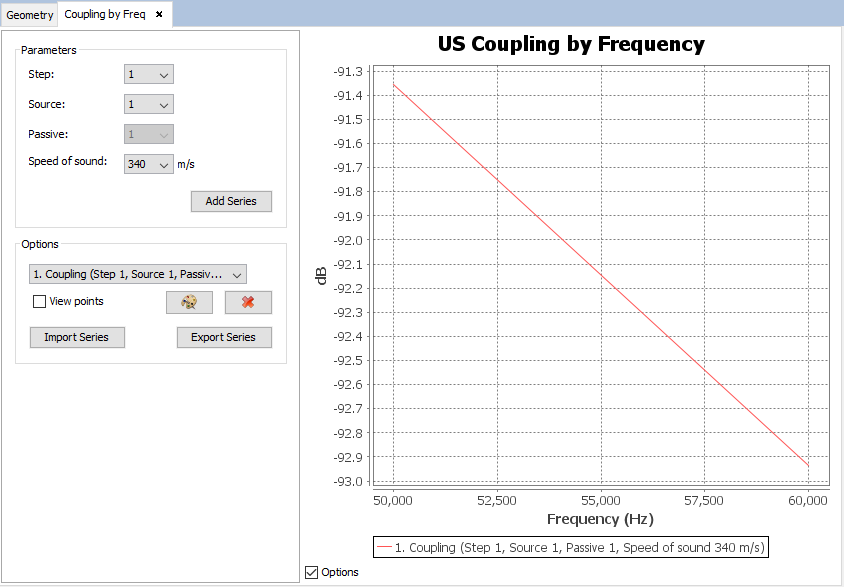
In the left panel, the user can select the independent parameters (those other than the one the coupling values are plotted against -- in the previous figure, that would be the frequency). This allows the user to configure the series they want to plot.
The selected series can be added to the plot by pressing the Add Series button. It is also possible to modify the look of a series previously added to the chart. You can change the color of a particular series by selecting it in the list and pressing the Change Colors.
Series can be imported and exported. To save a series click on the Export series button. It is possible to load previously exported series by pressing the Import Series button and locating the file where the results were saved in.