
Developer Tools
Enable the Developer ribbon to access the Python Debugger and UI Designer.
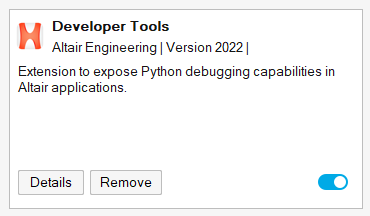
- On the File menu, click Extension Manager.
-
In the Developer Tools extension, toggle
Load to expose the Developer
ribbon.
Python Debugger
Click the Debug icon to activate Debug mode.
-
On the Developer ribbon, select the Debug
tool.

-
From the Debug menu, select Start
Debugging, or click the Debug icon
 .
Note: The Python script in the Editor must be saved first. Unsaved file names are appended with *.Other windows become available under the Debug menu once Debugging Mode is activated.
.
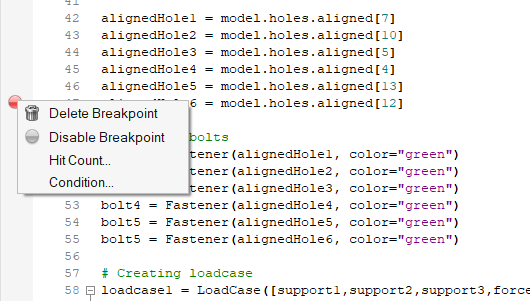
Note: The Python script in the Editor must be saved first. Unsaved file names are appended with *.Other windows become available under the Debug menu once Debugging Mode is activated. - Set the breakpoints by clicking the left margin next to the desired line.
-
Click Run File
 to start the debugging process.
Once a breakpoint is hit, an arrow is displayed inside of it. This indicates the next line of execution.
to start the debugging process.
Once a breakpoint is hit, an arrow is displayed inside of it. This indicates the next line of execution. -
Once a breakpoint is hit, select the next option:
- Click Step Over
 to execute the current line and move
over to execute the next one. The yellow arrow on the margin moves to that
point.
to execute the current line and move
over to execute the next one. The yellow arrow on the margin moves to that
point. - Click Step Into
 to enter any user written function
call at the current line of execution. If none exists, it behaves like
Step Over.
to enter any user written function
call at the current line of execution. If none exists, it behaves like
Step Over. - Conversely, click Step Out
 to come out of the current function
and to the point where the function was called.
to come out of the current function
and to the point where the function was called. - Click Step Until
 to resume execution until the next
breakpoint is hit in the remaining execution path or the end of script is
reached.
to resume execution until the next
breakpoint is hit in the remaining execution path or the end of script is
reached.
- Click Step Over
- Click the Inspire icon to return to the full application.
Model Window
The Model Window displays Inspire graphics changes as the code is executed.
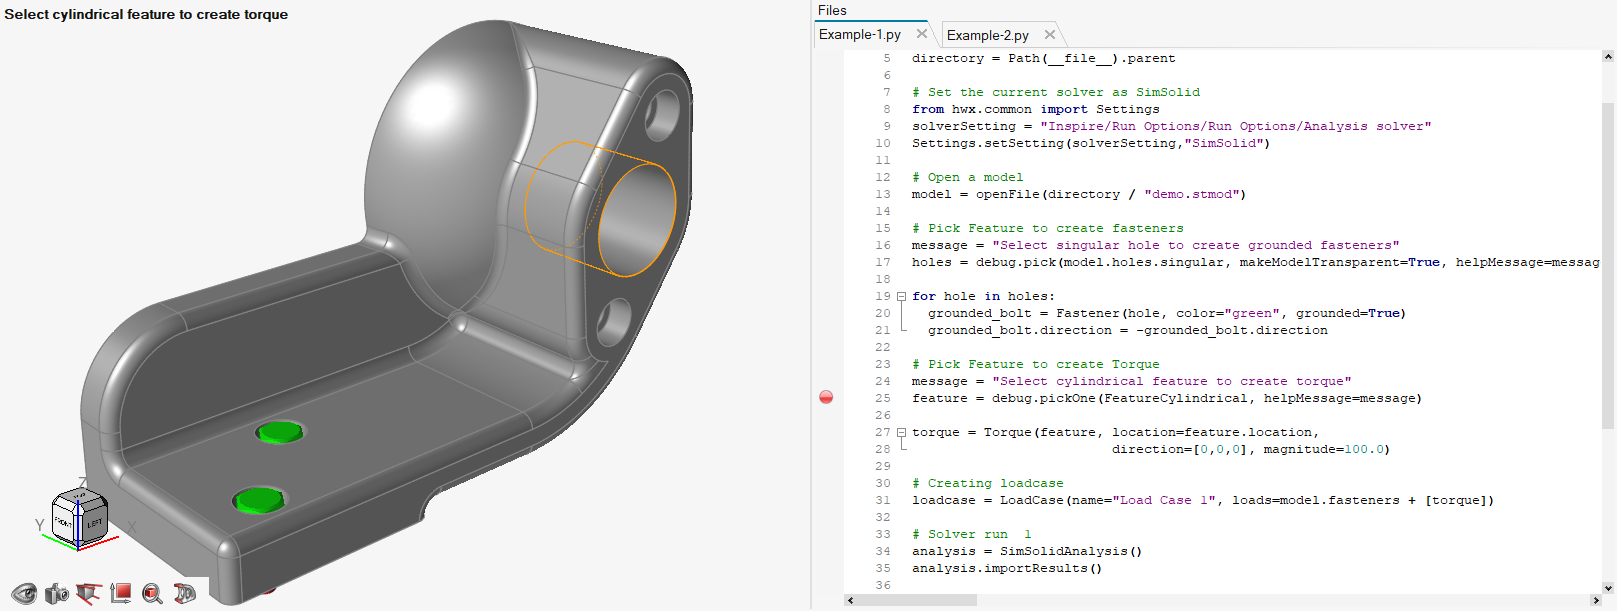
The components in the Model Window are transferred to Inspire on return.
The Inspire changes are retained on clicking the Inspire icon and returning to full Inspire mode.
Command History
The Command History displays a record of Python commands.
All commands that have been executed in the Python window are shown in order, with the last command at the top. Double-clicking a command calls the function again.
Python Variable Browser
Use the Python Variable Browser to monitor variable values while stepping through scripts.
By default, the Python Variable Window is not displayed. Use the View menu to show/hide the Python Variable Window.
Available variable names are listed, and the variable’s current value is displayed as well as its type and scope. The value can be overwritten by typing a new value. The changed value is used next.
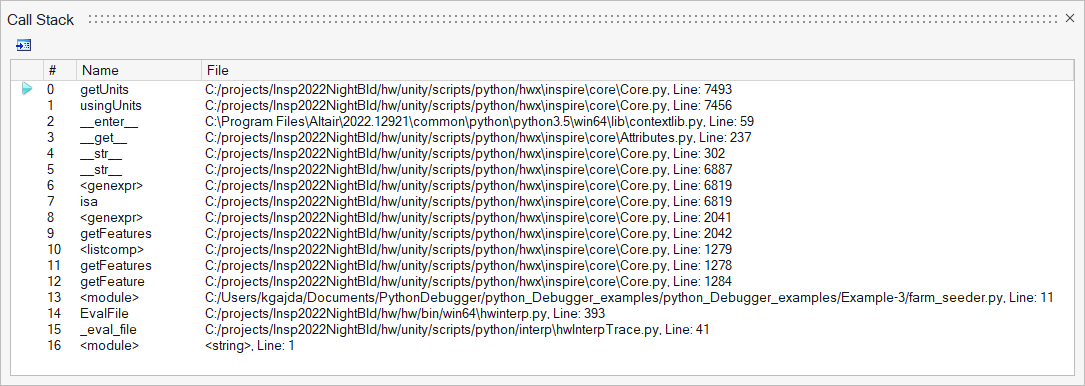
Call Stack Window
The Call Stack Window displays the paths traced while executing scripts.
The Call Stack Window is accessible only in debugging mode. And, by default, the Call Stack Window is not displayed. Use the to show/hide the Call Stack Window.
Watch Window
Use the Watch Window to monitor variable values while stepping through scripts.
The Watch Window is accessible only in debugging mode. And, by default, the Watch Window is not displayed. Use the menu to show/hide the Watch Window.
Variable names can be typed in the first column or can be dragged and placed there from the Editor. Alternatively, they can be added by highlighting them in the Editor and selecting the context menu option Add Selection to Watch. The variable’s current value (or values) is displayed in the second column. The value can be overwritten by typing a new value. The changed value is used next.
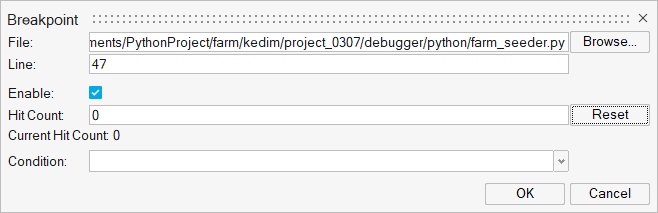
Breakpoints Window
The Breakpoints Window displays all breakpoints in the debugging session. Each breakpoint is listed along with its host file and the line number.
The Breakpoints Window is accessible only in debugging mode. And, by default, the Breakpoints Window is not displayed. Use the to show/hide the Breakpoints Window.
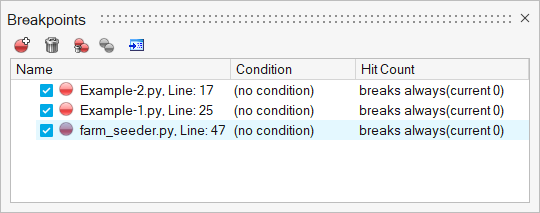
Individual breakpoints can be disabled by deactivating the box next to it. Breakpoints can also be created and deleted from this window. Clicking a breakpoint positions the cursor at that location in the Editor.
UI Designer
Create a graphical user interface with predefined objects from the UI Designer toolkit.
-
On the Developer ribbon, select the UI Designer tool.

The UI Designer opens in a new window.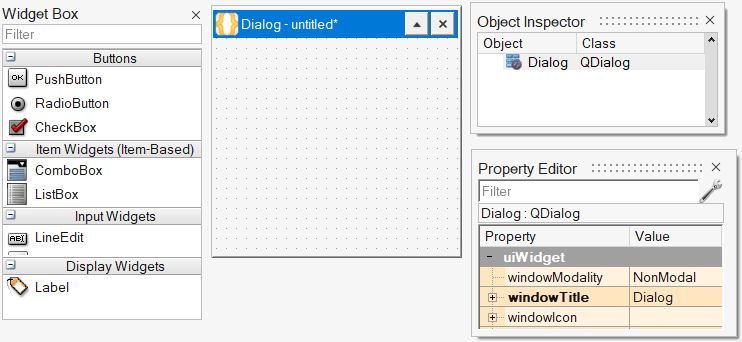
-
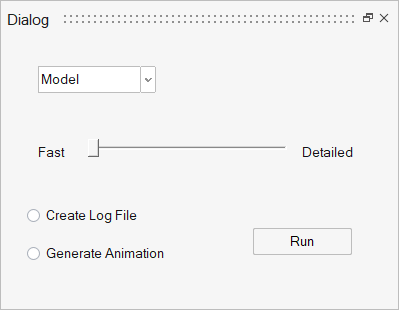
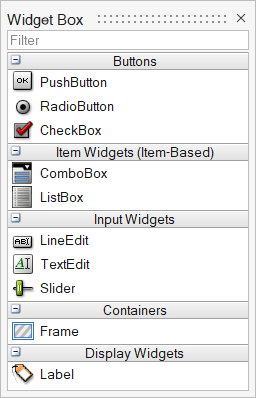
Drag objects from the Widget box into the Dialog to create your GUI
design.
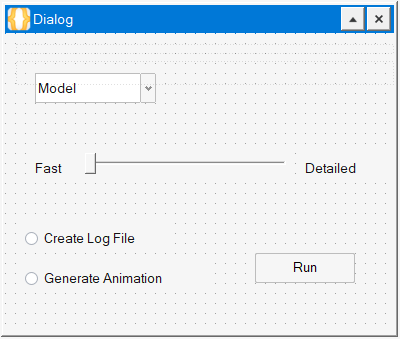
The following example shows a simple GUI with a list box, slider, radio buttons, push button and labels.
-
Modify the location, name, and properties of each object as required for your
design.
- To adjust location, select the object and move it with your mouse or arrow keys.
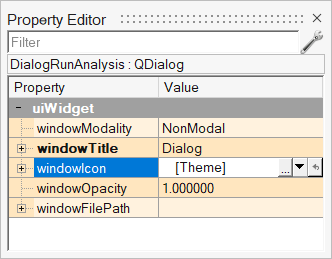
- To modify properties, select an object, then modify the desired
properties in the Property Editor.
You can also right-click an object and define a number of properties through the context menu.
Important: For information about laying out widgets automatically (for example, when a panel is resized or the text length changes in a localized GUI), see https://doc.qt.io/qt-5/designer-to-know.html#the-concept-of-layouts-in-qt. -
From the UI Designer ribbon, select the
Preview button.
 A preview of your graphical user interface design is displayed. Review your design, then close the Preview window.
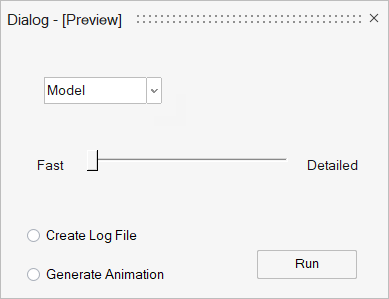
-
Save your design and specify your preferred file format:
Save As Description *.ui Saves your design as a UI Designer file. Use this file format when you want to continue working on your design through UI Designer. .py Saves your design as a Python file. Use this format to generate a code skeleton. Note: Once you save your design as code, you cannot load it back into the UI Designer. If you want to keep a working verision of your design that you can open through the UI Designer, save a version in .ui format before saving as code. - Return to the Inspire window and load the .py file with your design.
-
Run the file.
The software produces a GUI based on the code file you saved through the UI Designer.
Rename Objects
Use the Object Inspector, Property Editor, or context menu to rename objects in your user interface design.
-
Review the objects in your design.
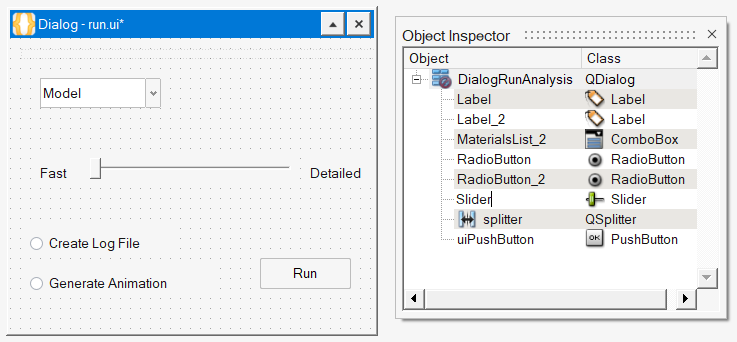 Note: The object names are not to be confused with text that can be used as a label such as "Fast" and "Detailed" that you see in the example Dialog. Text is an object itself and is listed in the Object Inspector.
 -
Change an object name with the following options:
Important: Spaces and special characters are not allowed in object names.
- Double-click an object in the Object Inspector and type in the desired
name.
The example shows the name change for the Slider object from SlidertoAnalysisType.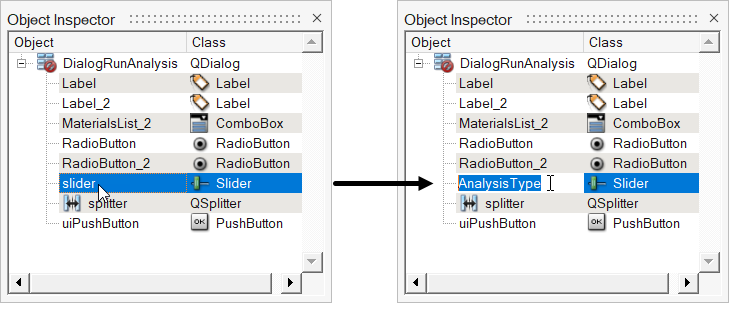
- Right-click an object in the Dialog or Object Inspector and select changeObjectname from the context menu, then type in the desired name in the microdialog.
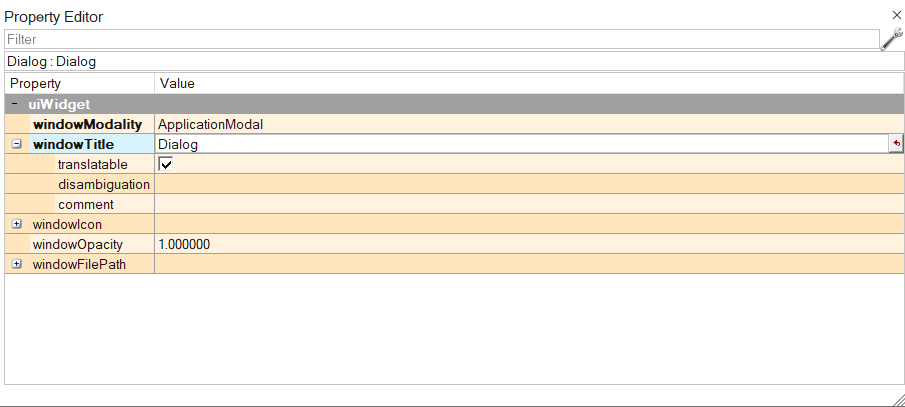
- In the Property Editor, select the [widget]Title
field, and then type in the desired name. The top-level dialog can only be
renamed in the Object Inspector.
Name changes are also reflected in the code when the design is saved as a Python file. - Double-click an object in the Object Inspector and type in the desired
name.
Modify Object Properties
Use the options in the Property Editor to modify objects in your user interface design.
Object Properties
| uiObject Property | Description |
|---|---|
| objectName | Specify a name for the object. |
| uiWidget Property | Description |
|---|---|
| enabled | Select this property to enable the object in the GUI. This
property correlates to the |
| geometry | Expand the geometry settings and define the object dimensions
as X and Y or Width and Height. This property correlates to
the |
| font | Expand and define the settings for font. |
| visible | Select this property to set the visibility of the widget as
on or off. This property correlates to the
|
| toolTip | Enter the tooltip text or specify a file for the tooltip. |